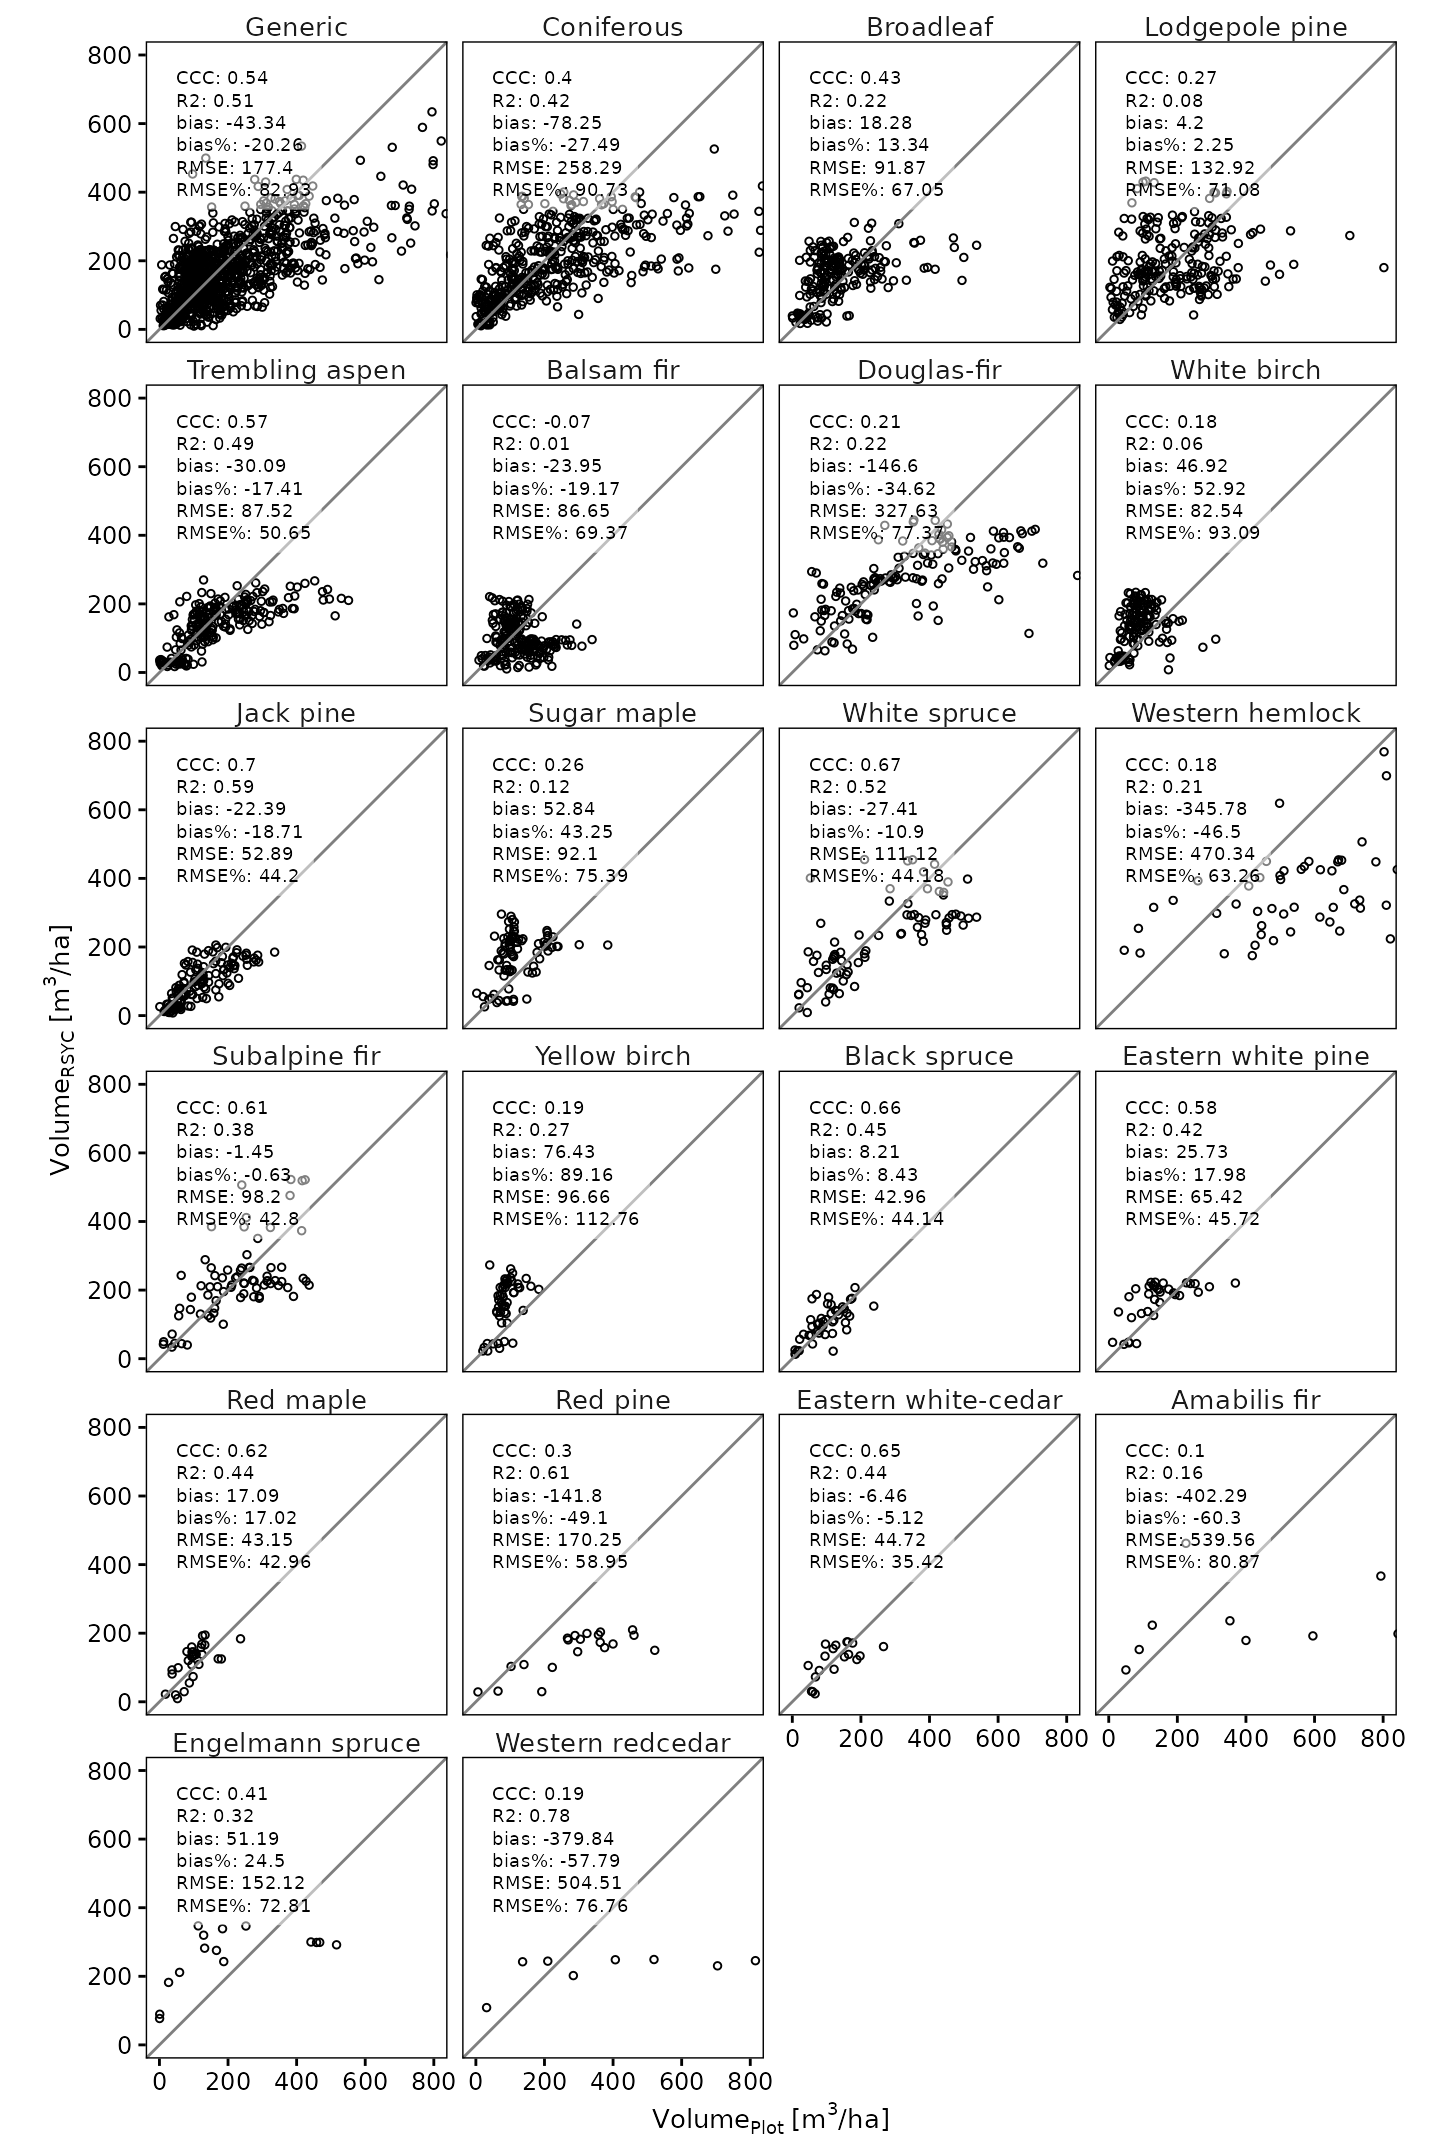
RSYC yield curves were validated against independent ground plots from MAGPlot (weighted plot means). Each curve was compared with the plots located in its tile or ecological unit. Plots were grouped into 20-year age classes, and plots older than 150 years were excluded. For each age class, the weighted mean of the plot observations and its 95% confidence interval (CI) were compared with the mean RSYC prediction for the same plots. See Tompalski et al. (2025) for more details about model validation.
Summary statistics
| Level | Model group | Models | Median CCC | Median R² | Median bias% | Median RMSE% |
|---|---|---|---|---|---|---|
| Tile | Generic | 142 | 0.44 | 0.63 | -15.4 | 42.1 |
| Tile | Species group | 170 | 0.46 | 0.60 | -15.2 | 44.7 |
| Tile | Species | 327 | 0.44 | 0.59 | -9.7 | 45.1 |
| Ecozone | Generic | 8 | 0.55 | 0.79 | -30.5 | 35.7 |
| Ecozone | Species group | 15 | 0.46 | 0.76 | -31.4 | 36.7 |
| Ecozone | Species | 55 | 0.51 | 0.66 | -23.3 | 36.7 |
| Ecoprovince | Generic | 20 | 0.60 | 0.72 | -21.4 | 36.4 |
| Ecoprovince | Species group | 33 | 0.58 | 0.73 | -20.0 | 35.9 |
| Ecoprovince | Species | 96 | 0.49 | 0.62 | -21.6 | 42.4 |
| Ecoregion | Generic | 63 | 0.41 | 0.73 | -31.0 | 47.5 |
| Ecoregion | Species group | 81 | 0.39 | 0.67 | -27.0 | 50.1 |
| Ecoregion | Species | 176 | 0.45 | 0.60 | -22.3 | 46.9 |
| Ecodistrict | Generic | 175 | 0.44 | 0.67 | -15.2 | 46.5 |
| Ecodistrict | Species group | 174 | 0.48 | 0.61 | -11.8 | 45.5 |
| Ecodistrict | Species | 329 | 0.44 | 0.61 | -6.8 | 44.5 |
| Level | Model group | Models | Median CCC | Median R² | Median bias% | Median RMSE% |
|---|---|---|---|---|---|---|
| Tile | Generic | 89 | 0.50 | 0.64 | -15.1 | 41.8 |
| Tile | Species group | 108 | 0.50 | 0.64 | -15.2 | 44.0 |
| Tile | Species | 188 | 0.45 | 0.59 | 0.2 | 44.8 |
| Ecozone | Generic | 6 | 0.59 | 0.80 | -28.4 | 32.2 |
| Ecozone | Species group | 11 | 0.44 | 0.67 | -28.4 | 35.5 |
| Ecozone | Species | 44 | 0.51 | 0.66 | -23.2 | 38.2 |
| Ecoprovince | Generic | 17 | 0.65 | 0.73 | -19.9 | 36.4 |
| Ecoprovince | Species group | 27 | 0.62 | 0.71 | -19.3 | 35.1 |
| Ecoprovince | Species | 75 | 0.49 | 0.63 | -21.1 | 42.2 |
| Ecoregion | Generic | 57 | 0.44 | 0.74 | -29.5 | 45.2 |
| Ecoregion | Species group | 65 | 0.44 | 0.66 | -27.3 | 46.4 |
| Ecoregion | Species | 136 | 0.45 | 0.64 | -21.9 | 47.6 |
| Ecodistrict | Generic | 167 | 0.45 | 0.65 | -17.0 | 46.6 |
| Ecodistrict | Species group | 138 | 0.50 | 0.62 | -10.7 | 43.6 |
| Ecodistrict | Species | 236 | 0.41 | 0.60 | -6.7 | 45.3 |
| Level | Model group | Models | Median CCC | Median R² | Median bias% | Median RMSE% |
|---|---|---|---|---|---|---|
| Tile | Generic | 145 | 0.42 | 0.61 | -8.0 | 48.7 |
| Tile | Species group | 170 | 0.43 | 0.58 | -7.1 | 48.1 |
| Tile | Species | 329 | 0.42 | 0.57 | -1.0 | 48.4 |
| Ecozone | Generic | 8 | 0.67 | 0.80 | -22.9 | 31.3 |
| Ecozone | Species group | 15 | 0.55 | 0.73 | -20.0 | 34.5 |
| Ecozone | Species | 57 | 0.58 | 0.66 | -18.9 | 37.4 |
| Ecoprovince | Generic | 21 | 0.55 | 0.74 | -16.1 | 36.4 |
| Ecoprovince | Species group | 34 | 0.61 | 0.70 | -13.1 | 37.4 |
| Ecoprovince | Species | 94 | 0.55 | 0.64 | -15.3 | 41.6 |
| Ecoregion | Generic | 64 | 0.43 | 0.72 | -25.9 | 45.5 |
| Ecoregion | Species group | 80 | 0.41 | 0.64 | -18.5 | 51.3 |
| Ecoregion | Species | 177 | 0.44 | 0.62 | -14.4 | 45.6 |
| Ecodistrict | Generic | 179 | 0.40 | 0.64 | -7.7 | 50.0 |
| Ecodistrict | Species group | 176 | 0.46 | 0.58 | -6.3 | 49.1 |
| Ecodistrict | Species | 331 | 0.43 | 0.60 | 1.9 | 48.4 |
| Level | Model group | Models | Median CCC | Median R² | Median bias% | Median RMSE% |
|---|---|---|---|---|---|---|
| Tile | Generic | 86 | 0.47 | 0.60 | -3.1 | 48.0 |
| Tile | Species group | 90 | 0.49 | 0.60 | -5.0 | 45.3 |
| Tile | Species | 165 | 0.44 | 0.58 | 9.3 | 48.2 |
| Ecozone | Generic | 7 | 0.69 | 0.78 | -20.6 | 33.1 |
| Ecozone | Species group | 11 | 0.56 | 0.67 | -22.1 | 37.4 |
| Ecozone | Species | 47 | 0.54 | 0.63 | -16.4 | 40.6 |
| Ecoprovince | Generic | 19 | 0.67 | 0.73 | -16.4 | 35.9 |
| Ecoprovince | Species group | 25 | 0.61 | 0.67 | -15.6 | 37.1 |
| Ecoprovince | Species | 77 | 0.54 | 0.64 | -15.5 | 40.8 |
| Ecoregion | Generic | 59 | 0.43 | 0.73 | -21.0 | 44.8 |
| Ecoregion | Species group | 53 | 0.41 | 0.64 | -14.8 | 49.5 |
| Ecoregion | Species | 148 | 0.41 | 0.62 | -15.2 | 46.6 |
| Ecodistrict | Generic | 171 | 0.42 | 0.63 | -9.5 | 50.1 |
| Ecodistrict | Species group | 105 | 0.44 | 0.58 | -5.8 | 53.3 |
| Ecodistrict | Species | 263 | 0.39 | 0.59 | -1.7 | 50.5 |
Observed vs predicted
AGB
National models
4,098 age-class points from 634 curves. Map these curves in the curve explorer.
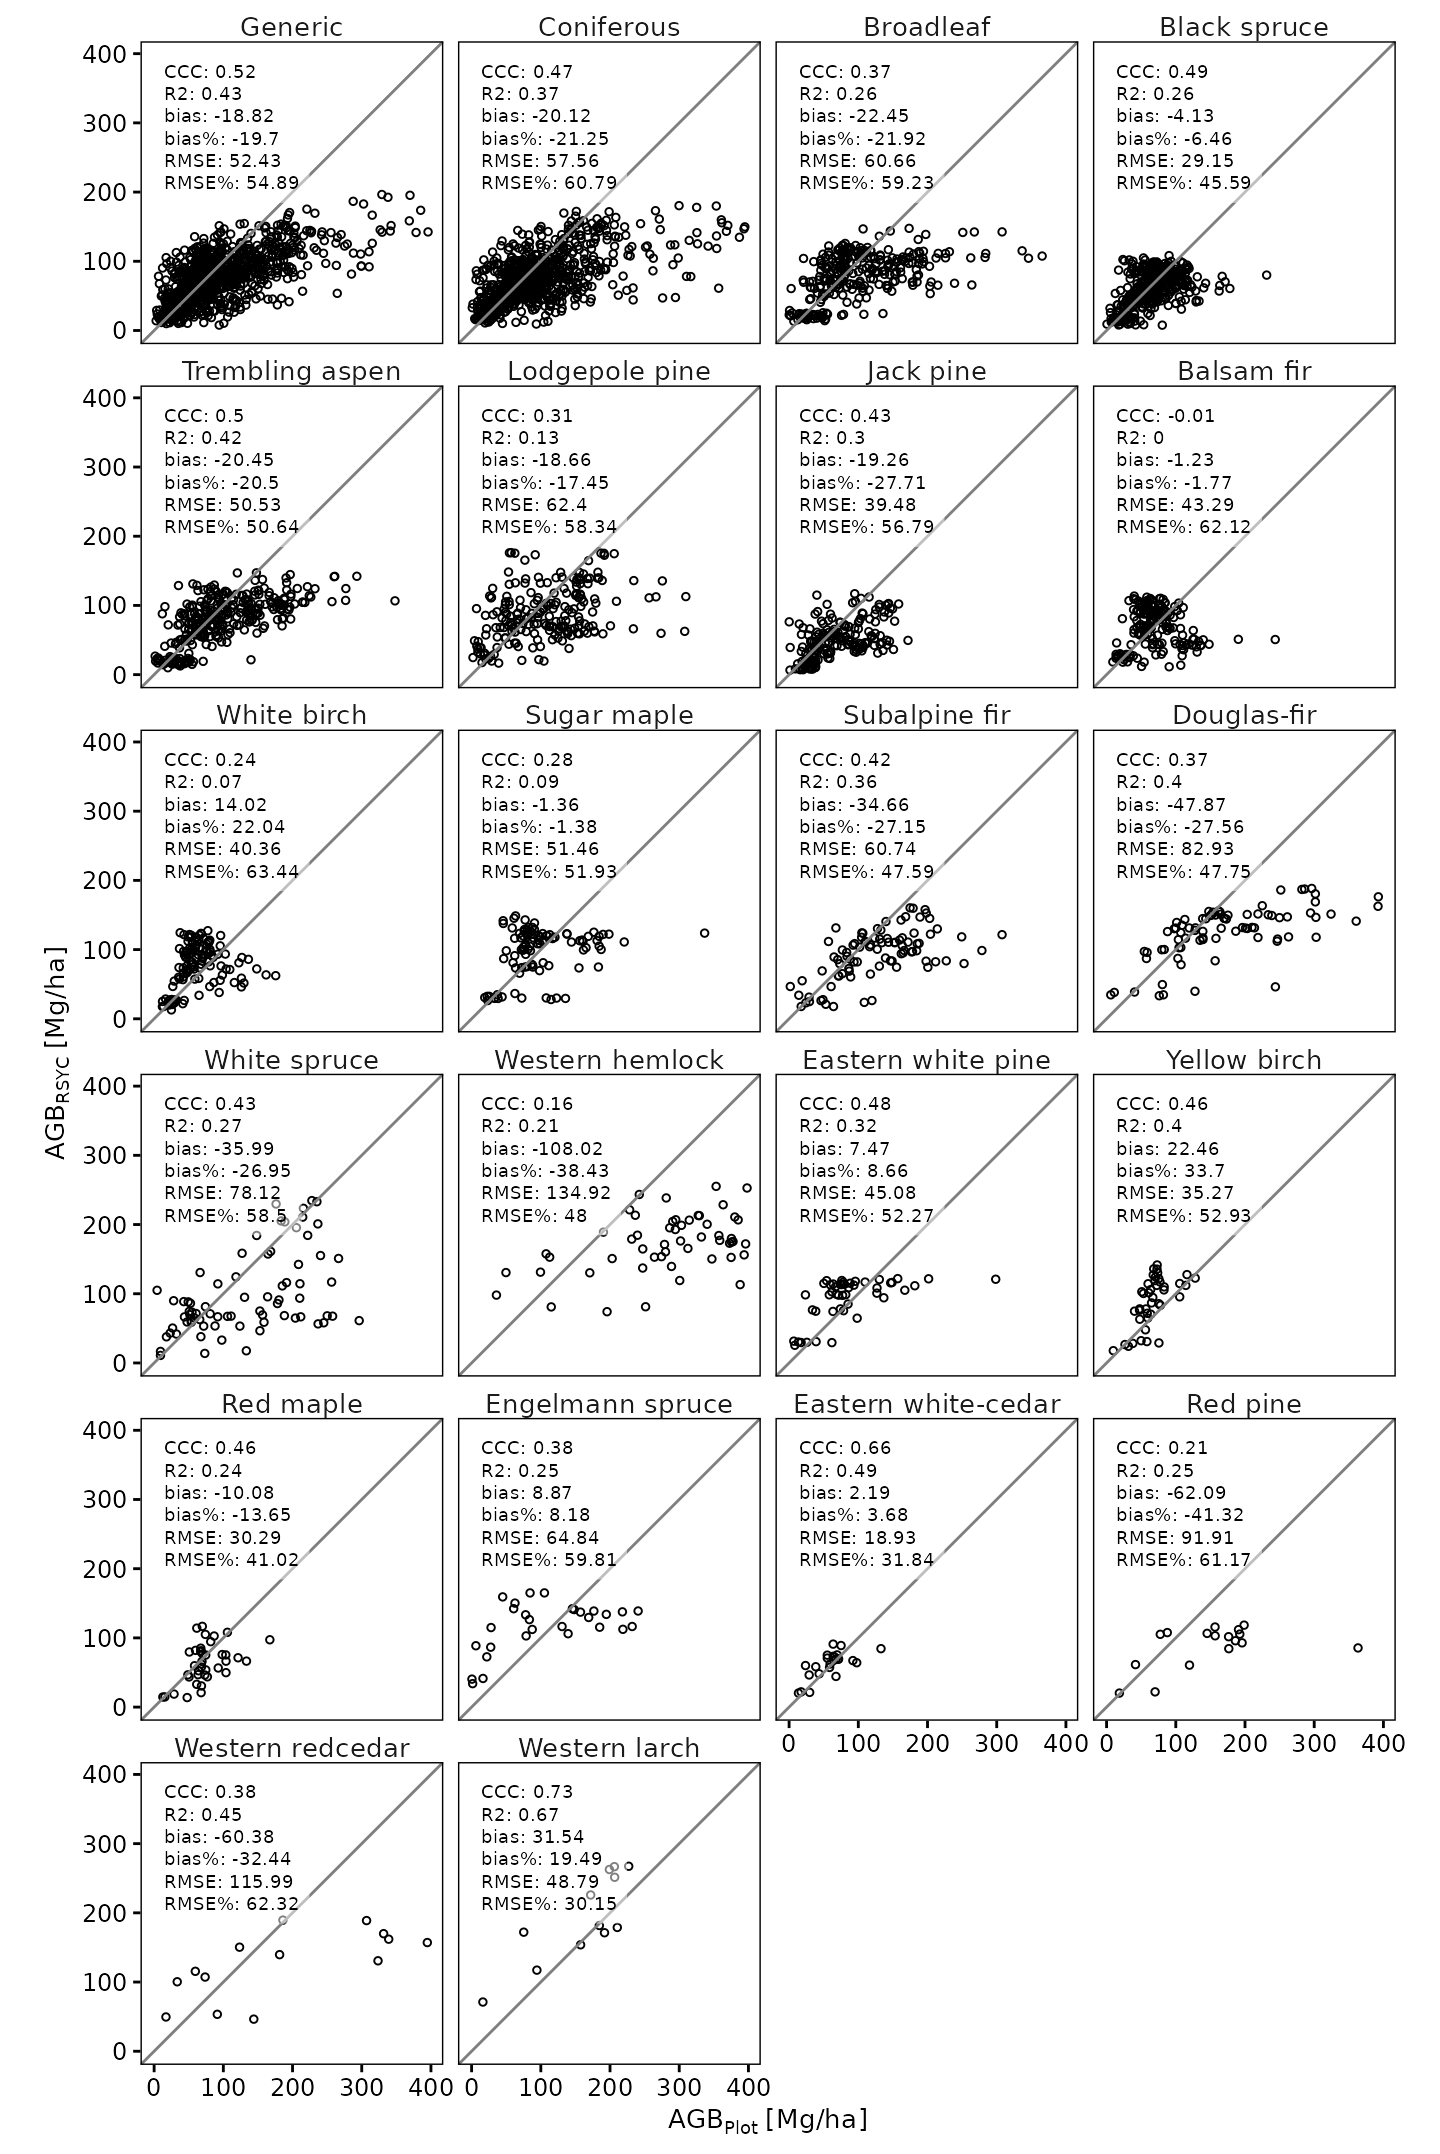
514 age-class points from 73 curves. Map these curves in the curve explorer.
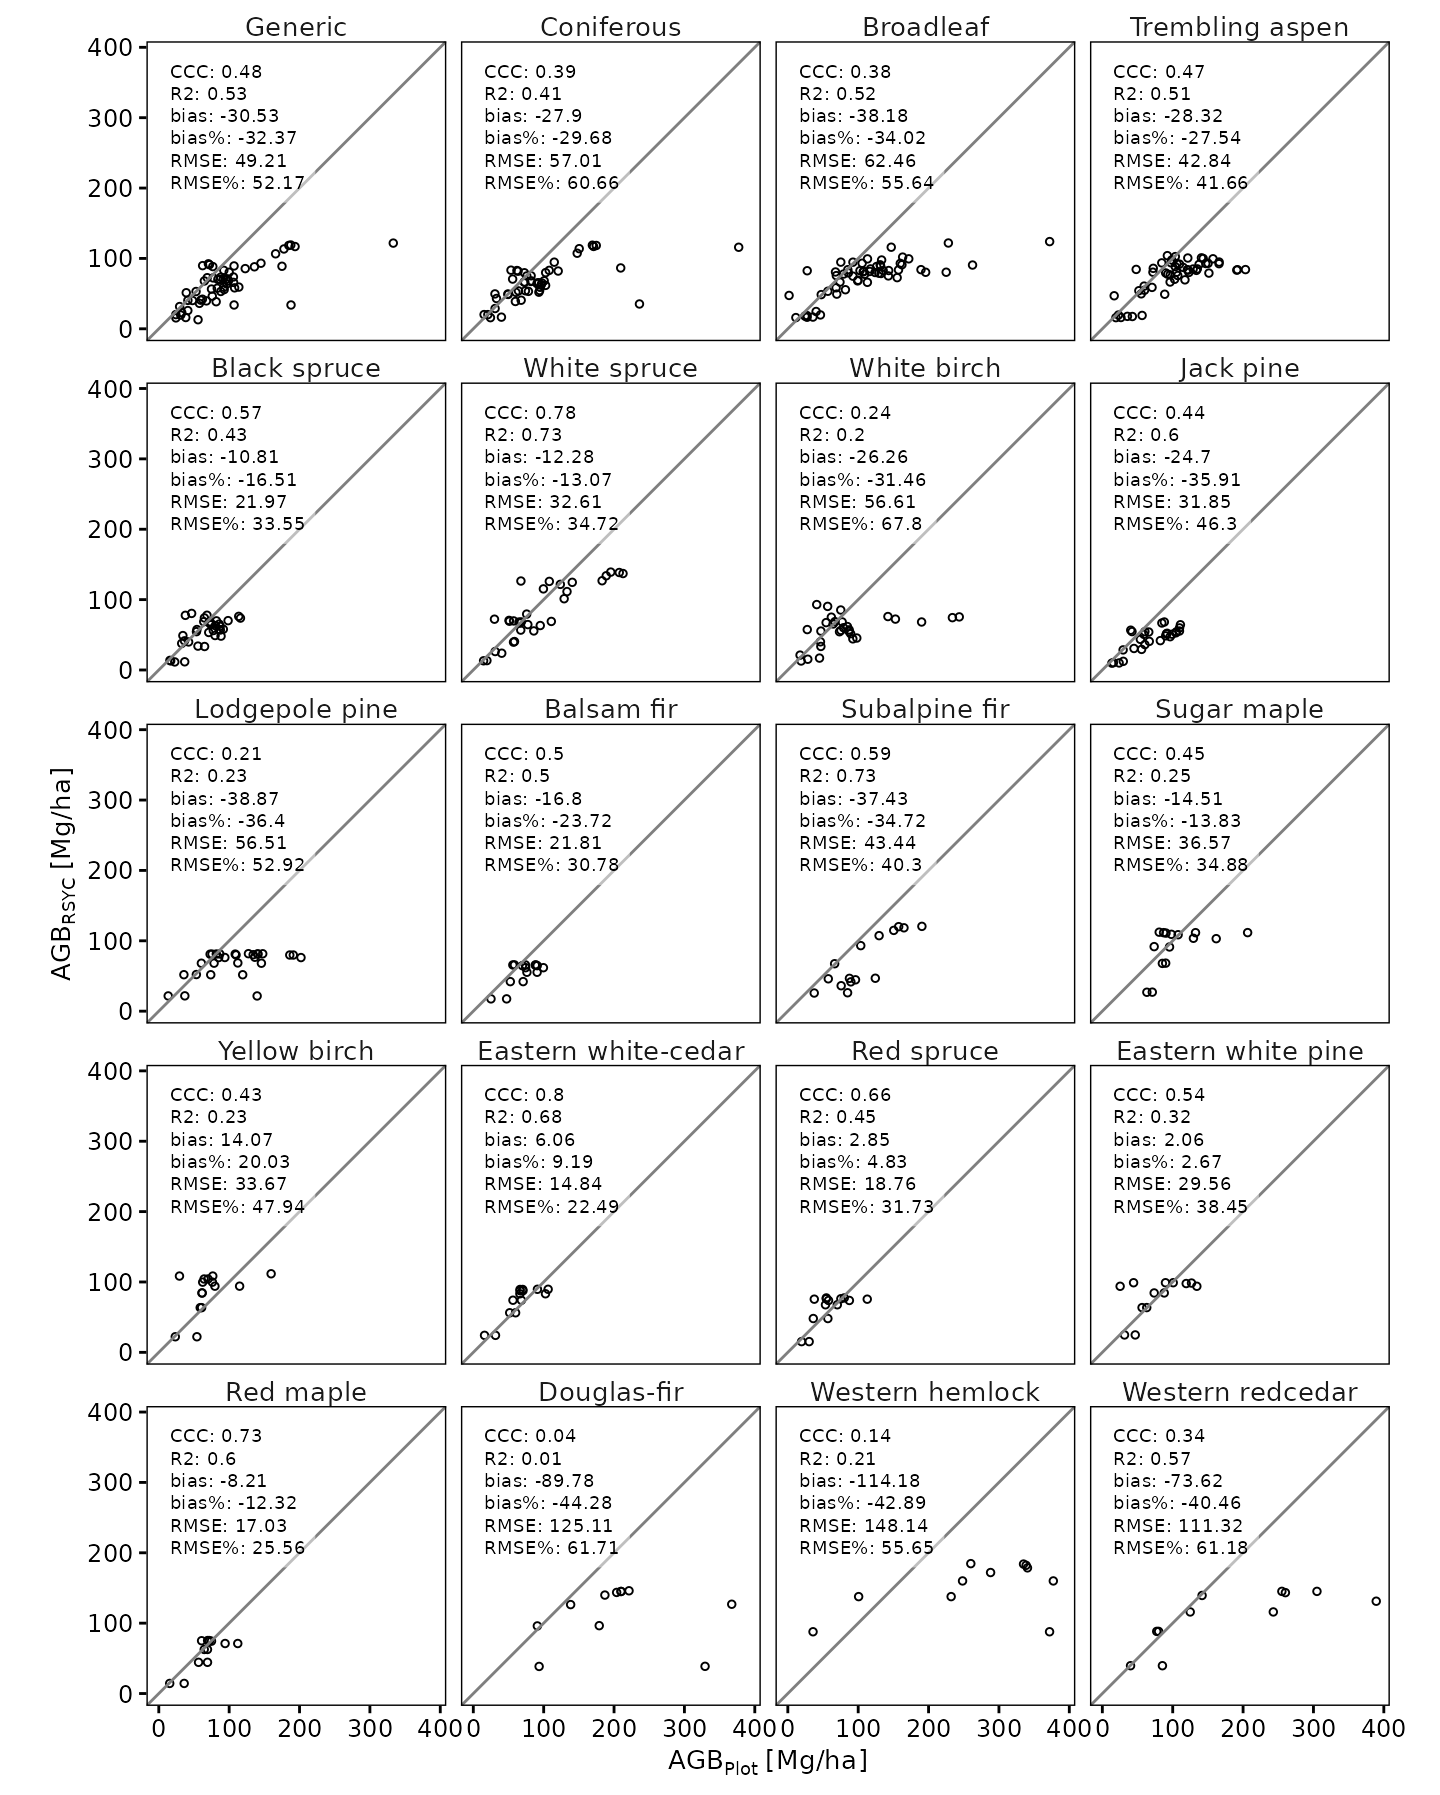
1,002 age-class points from 142 curves. Map these curves in the curve explorer.
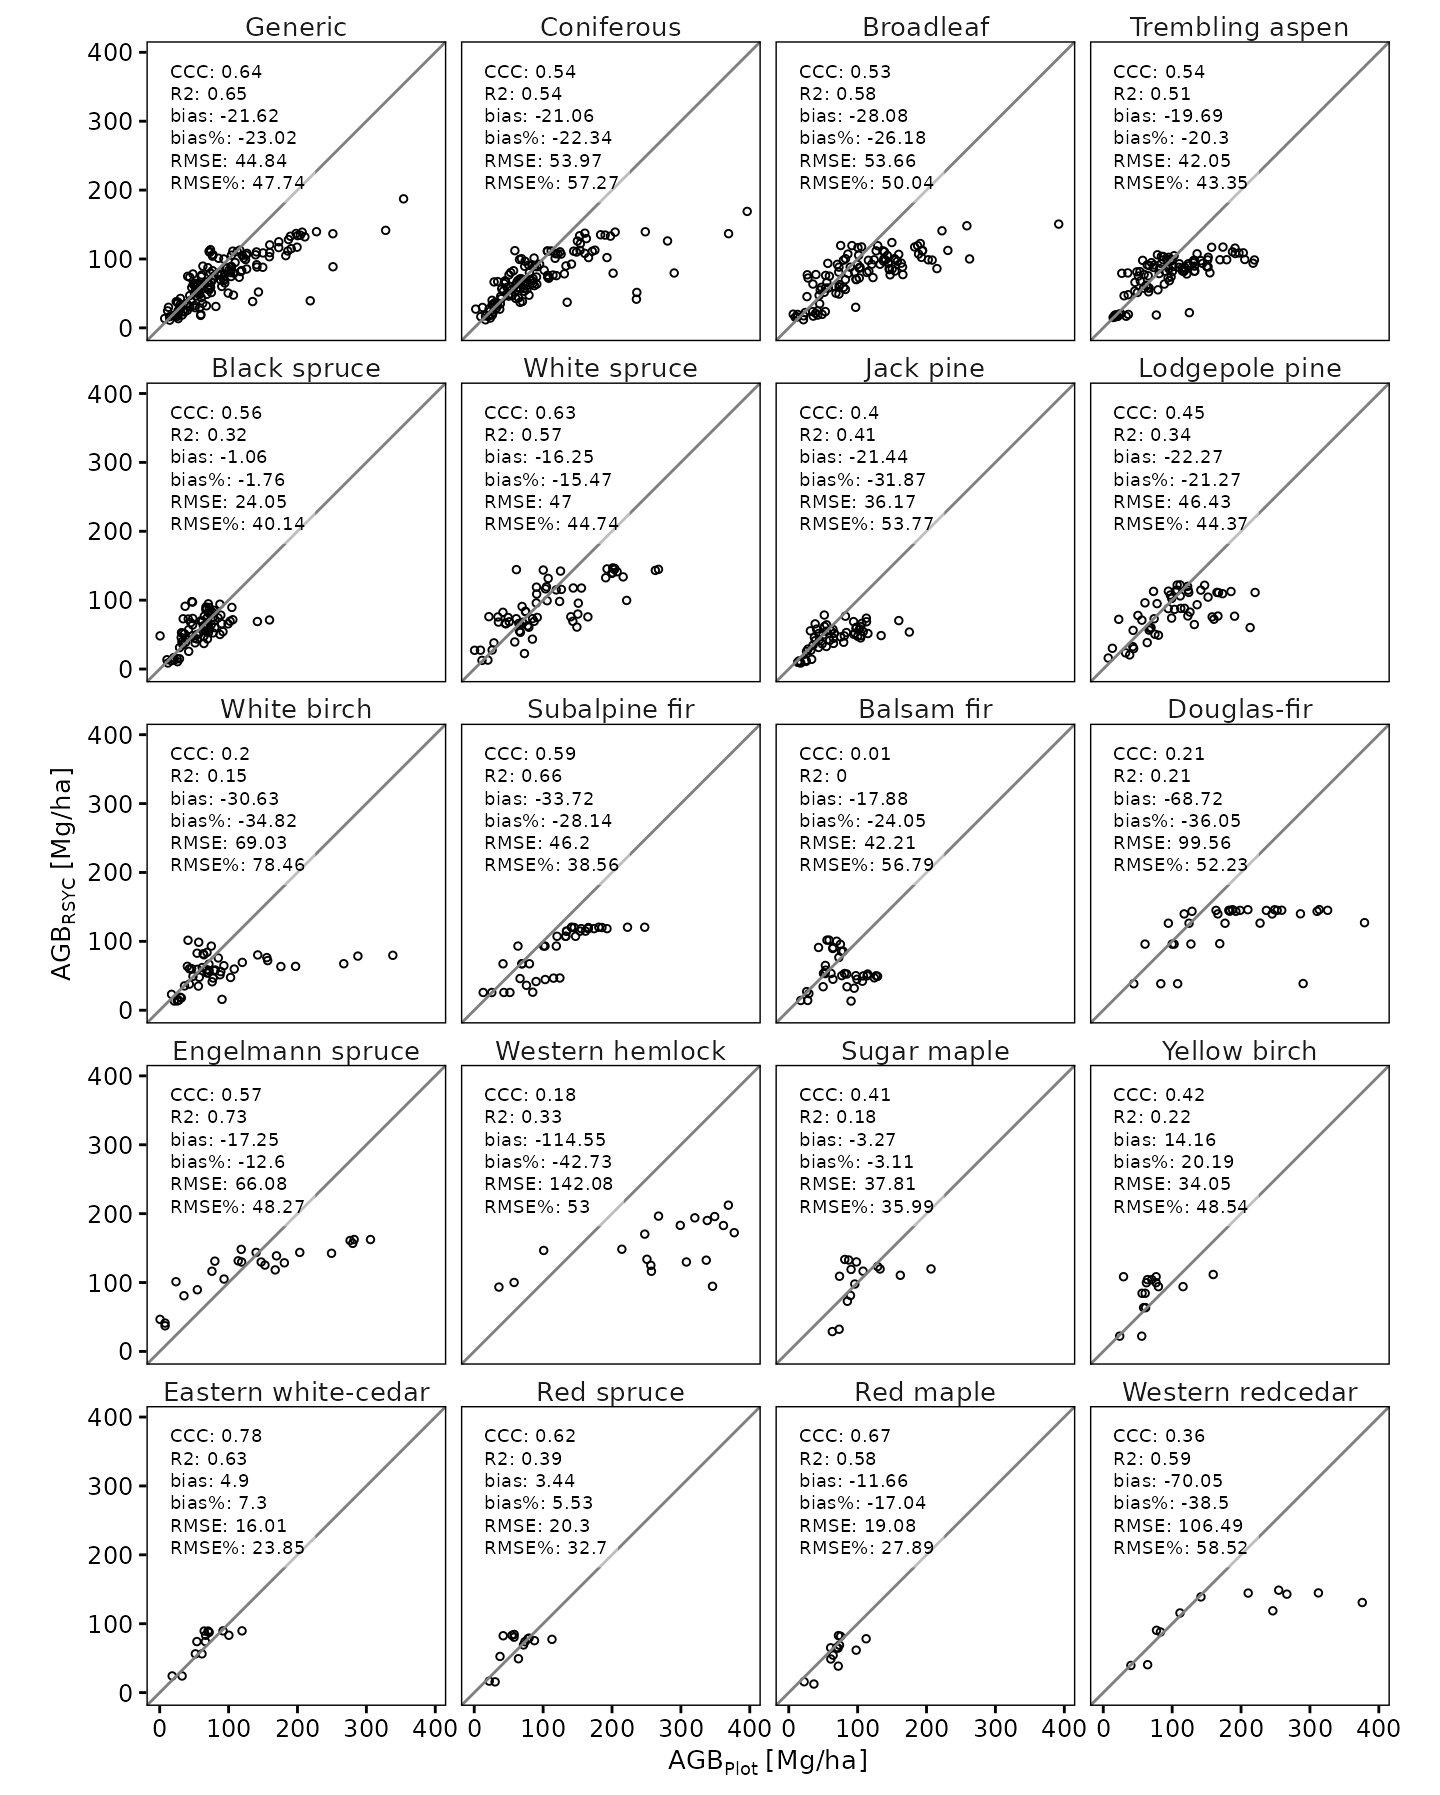
2,116 age-class points from 319 curves. Map these curves in the curve explorer.
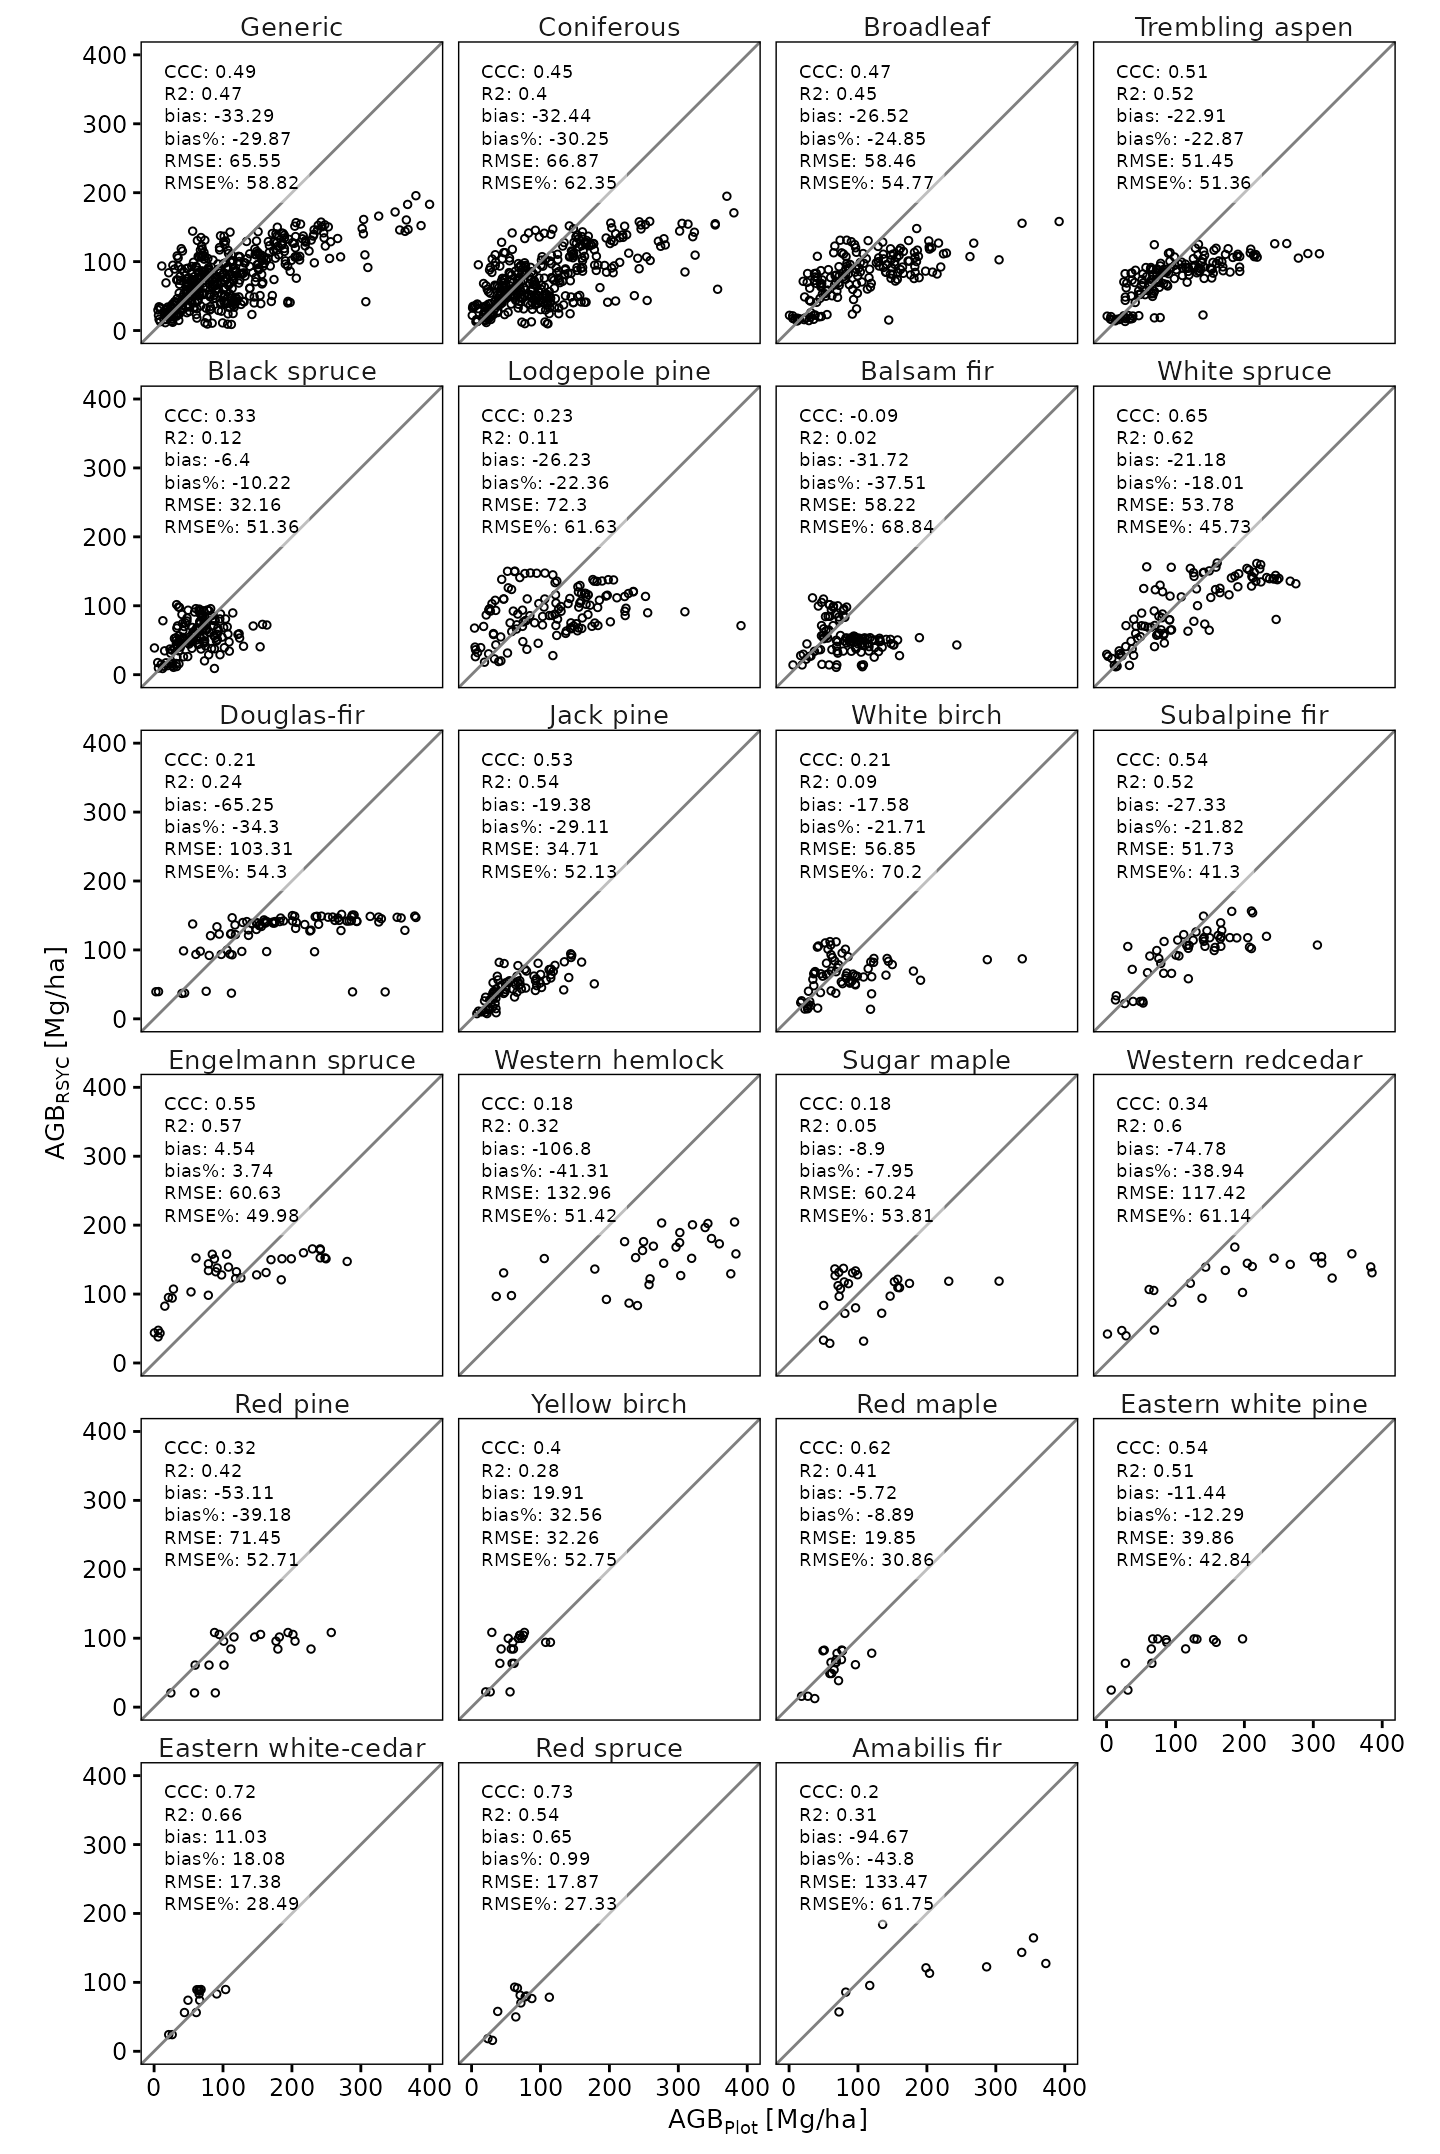
4,207 age-class points from 673 curves. Map these curves in the curve explorer.
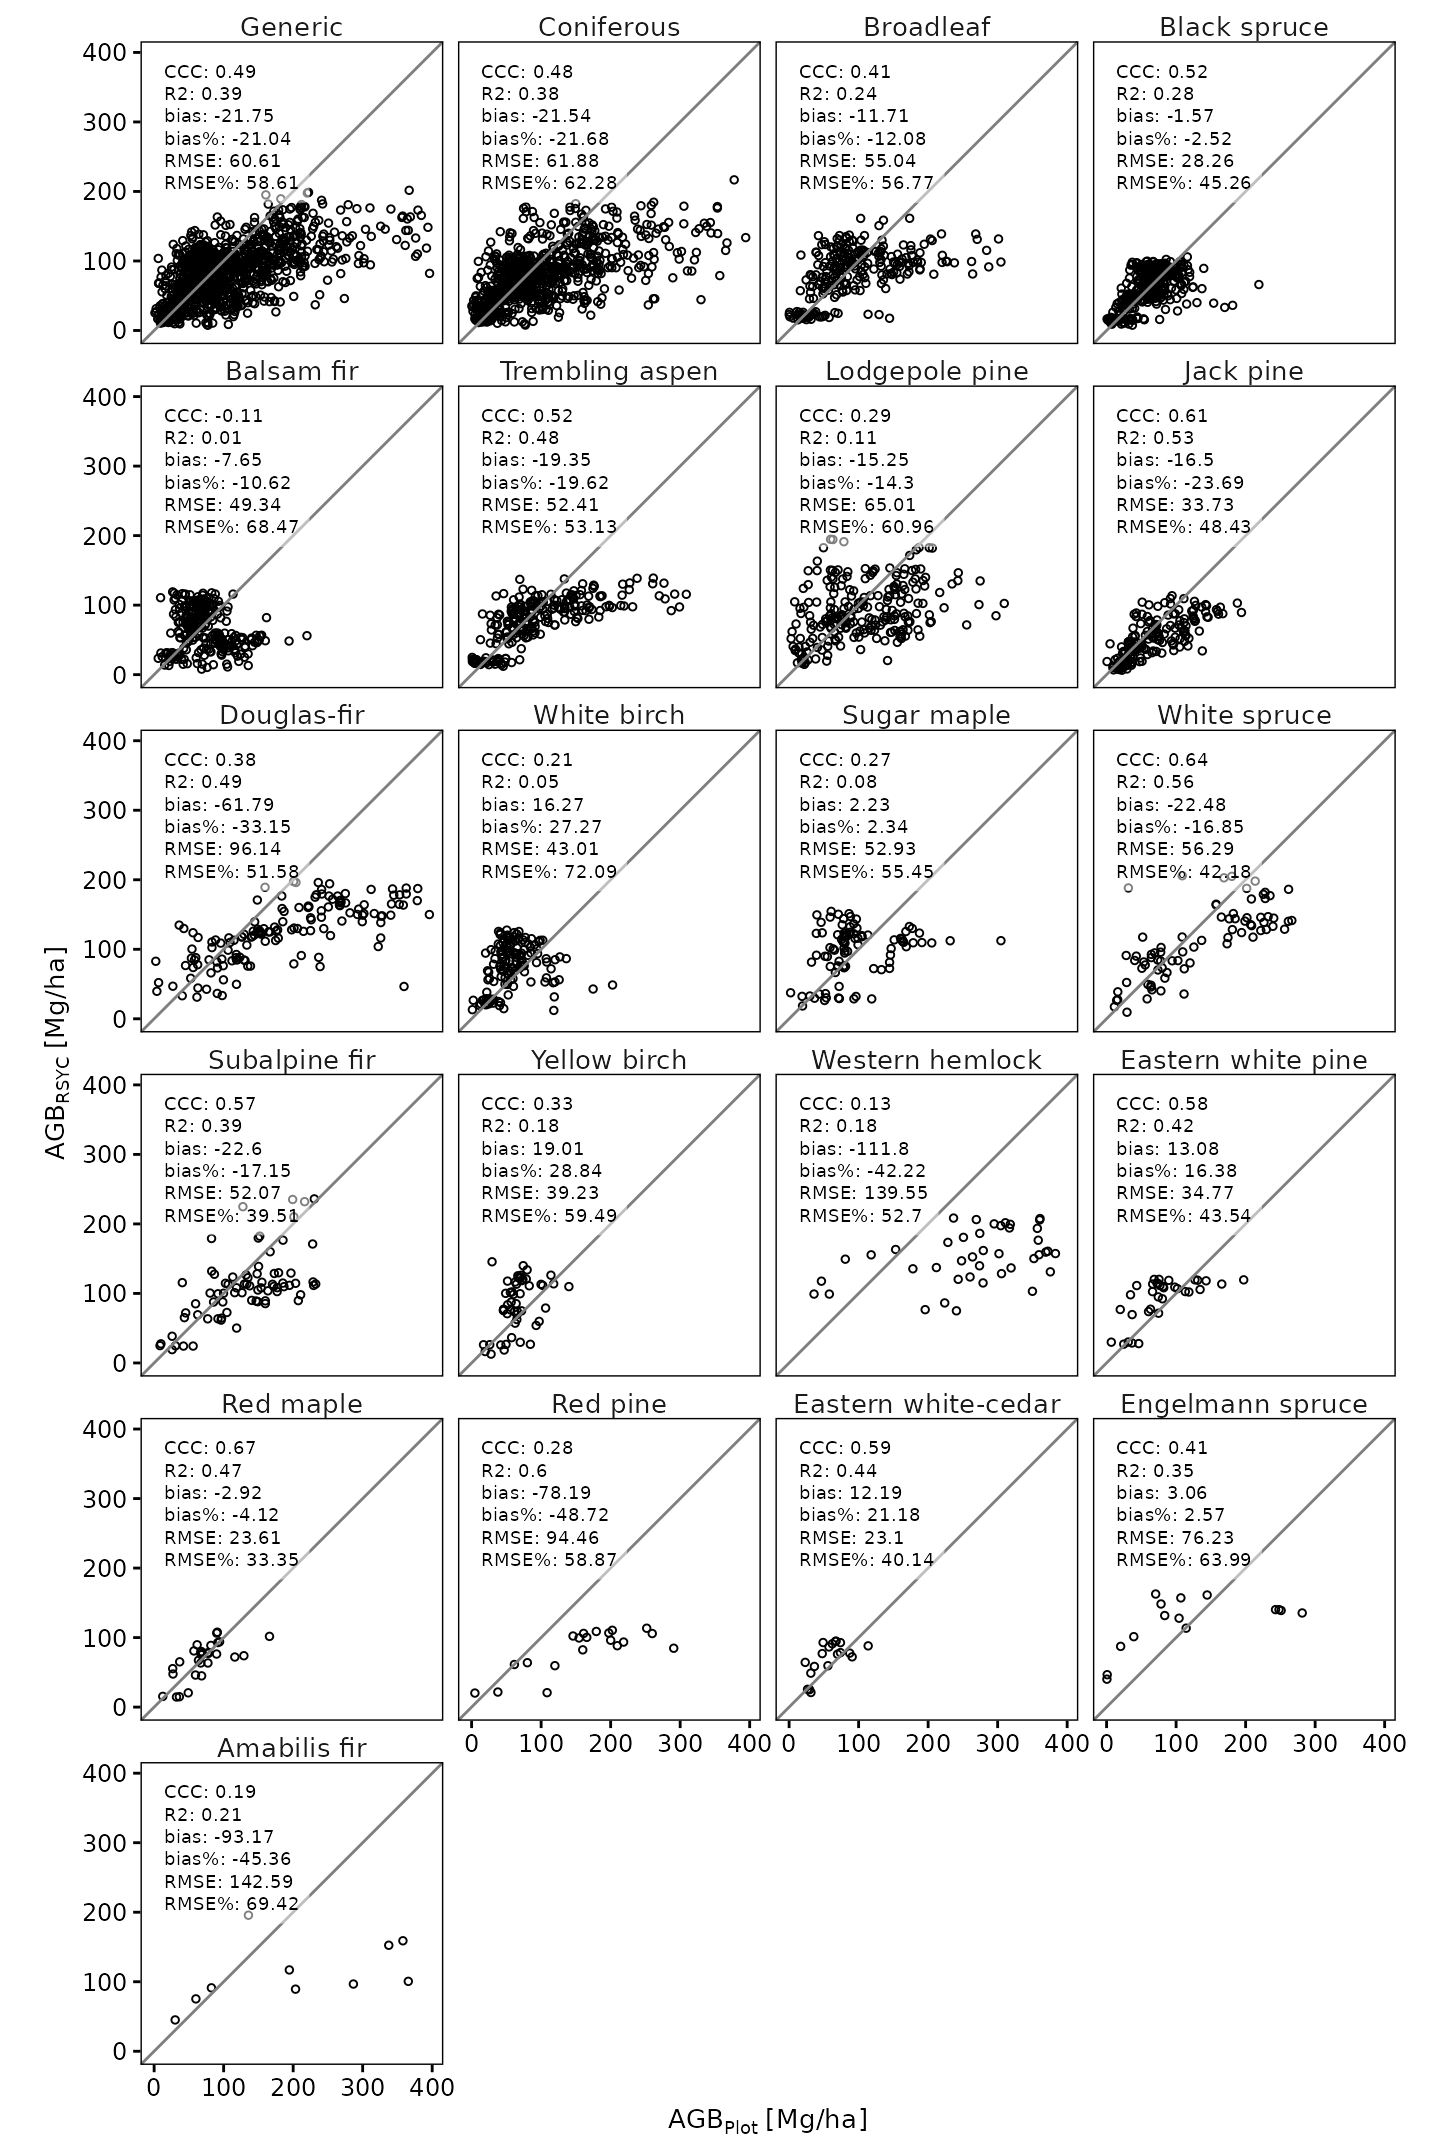
Regional models
2,486 age-class points from 382 curves. Map these curves in the curve explorer.
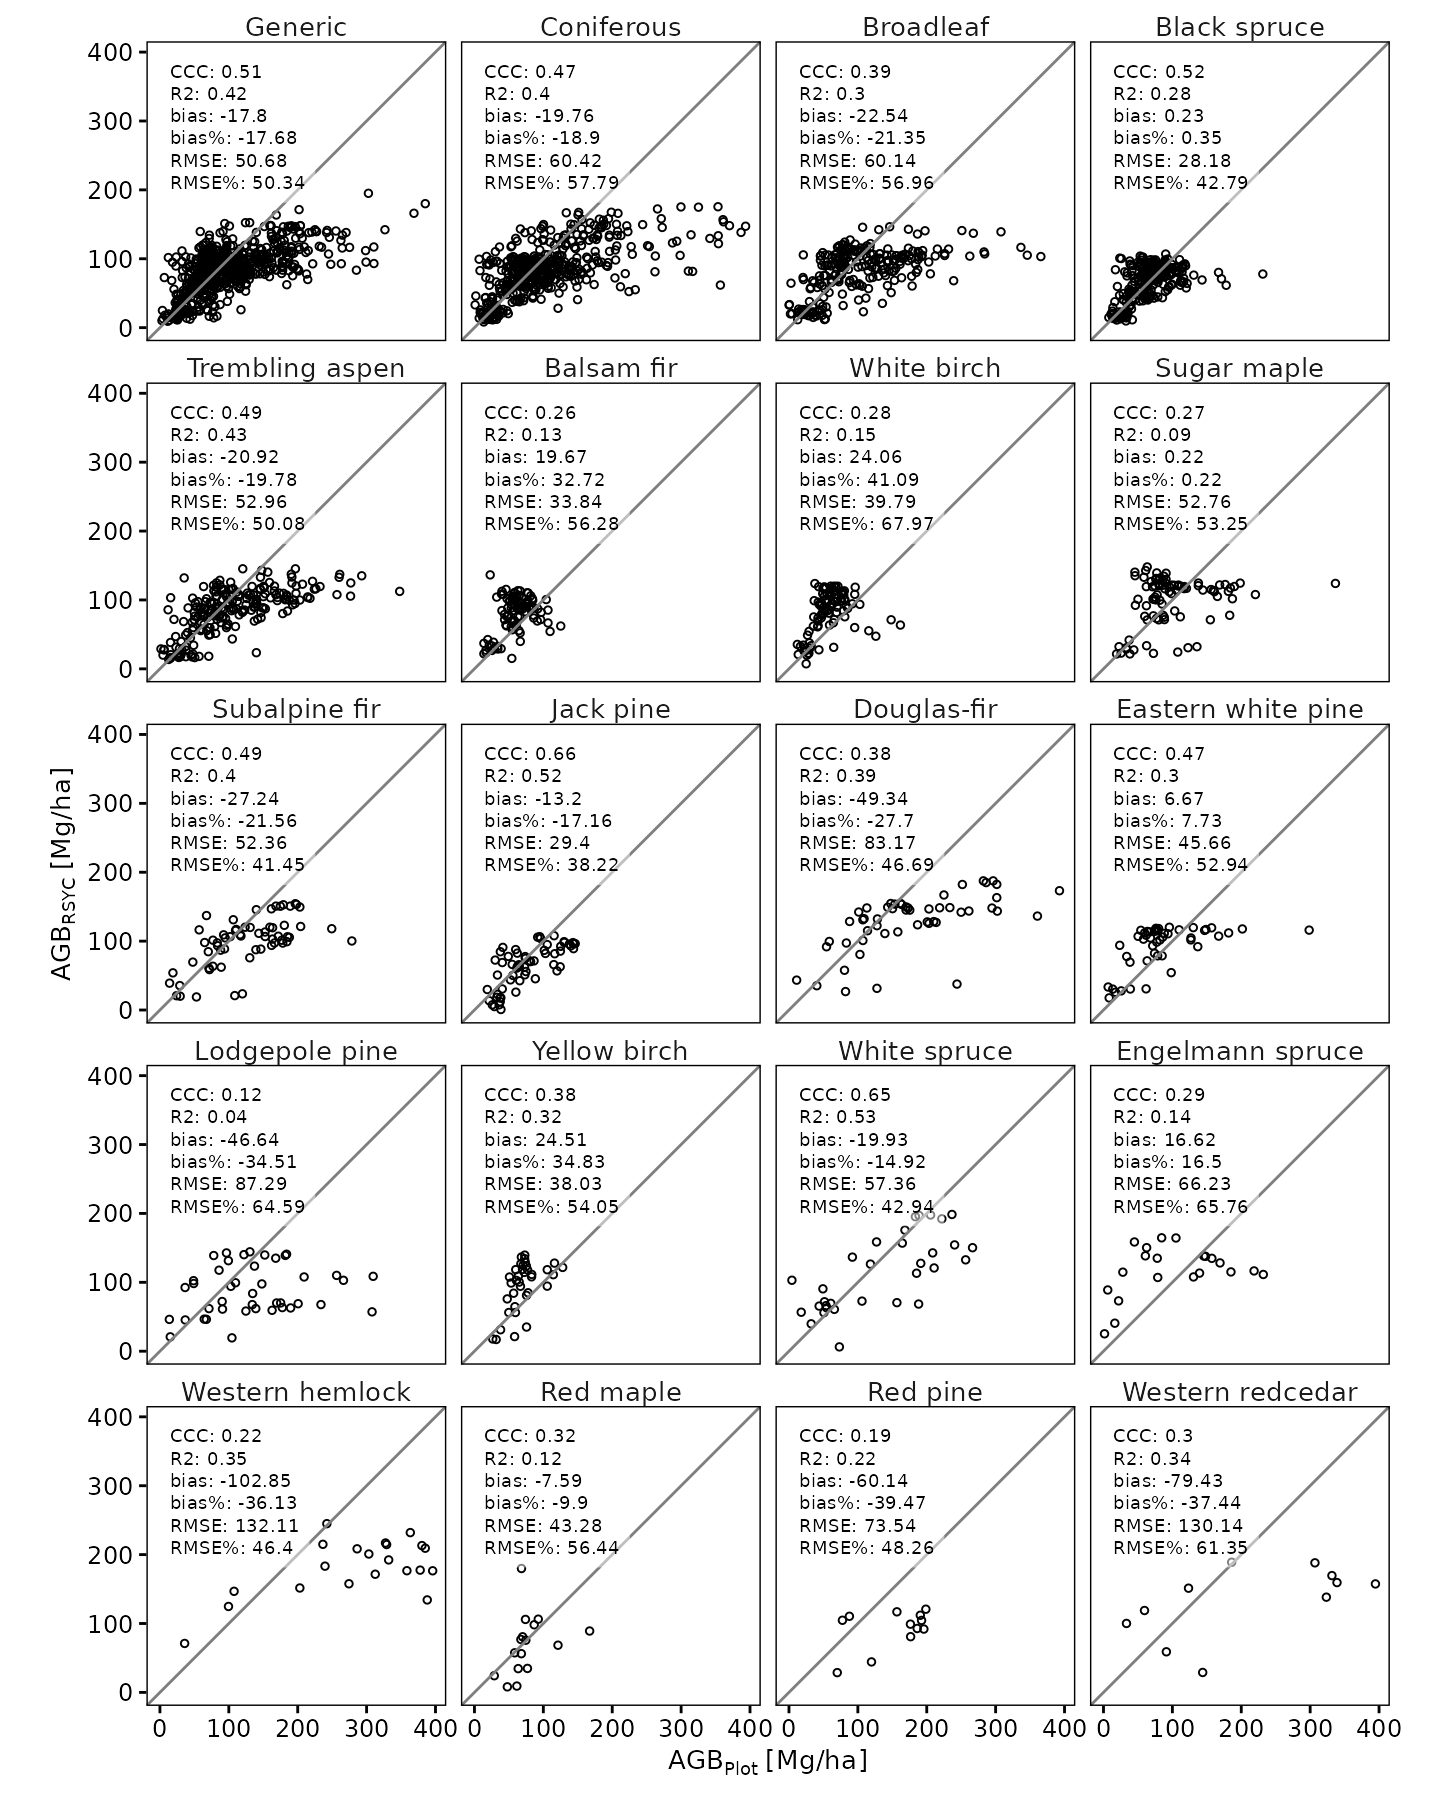
361 age-class points from 51 curves. Map these curves in the curve explorer.
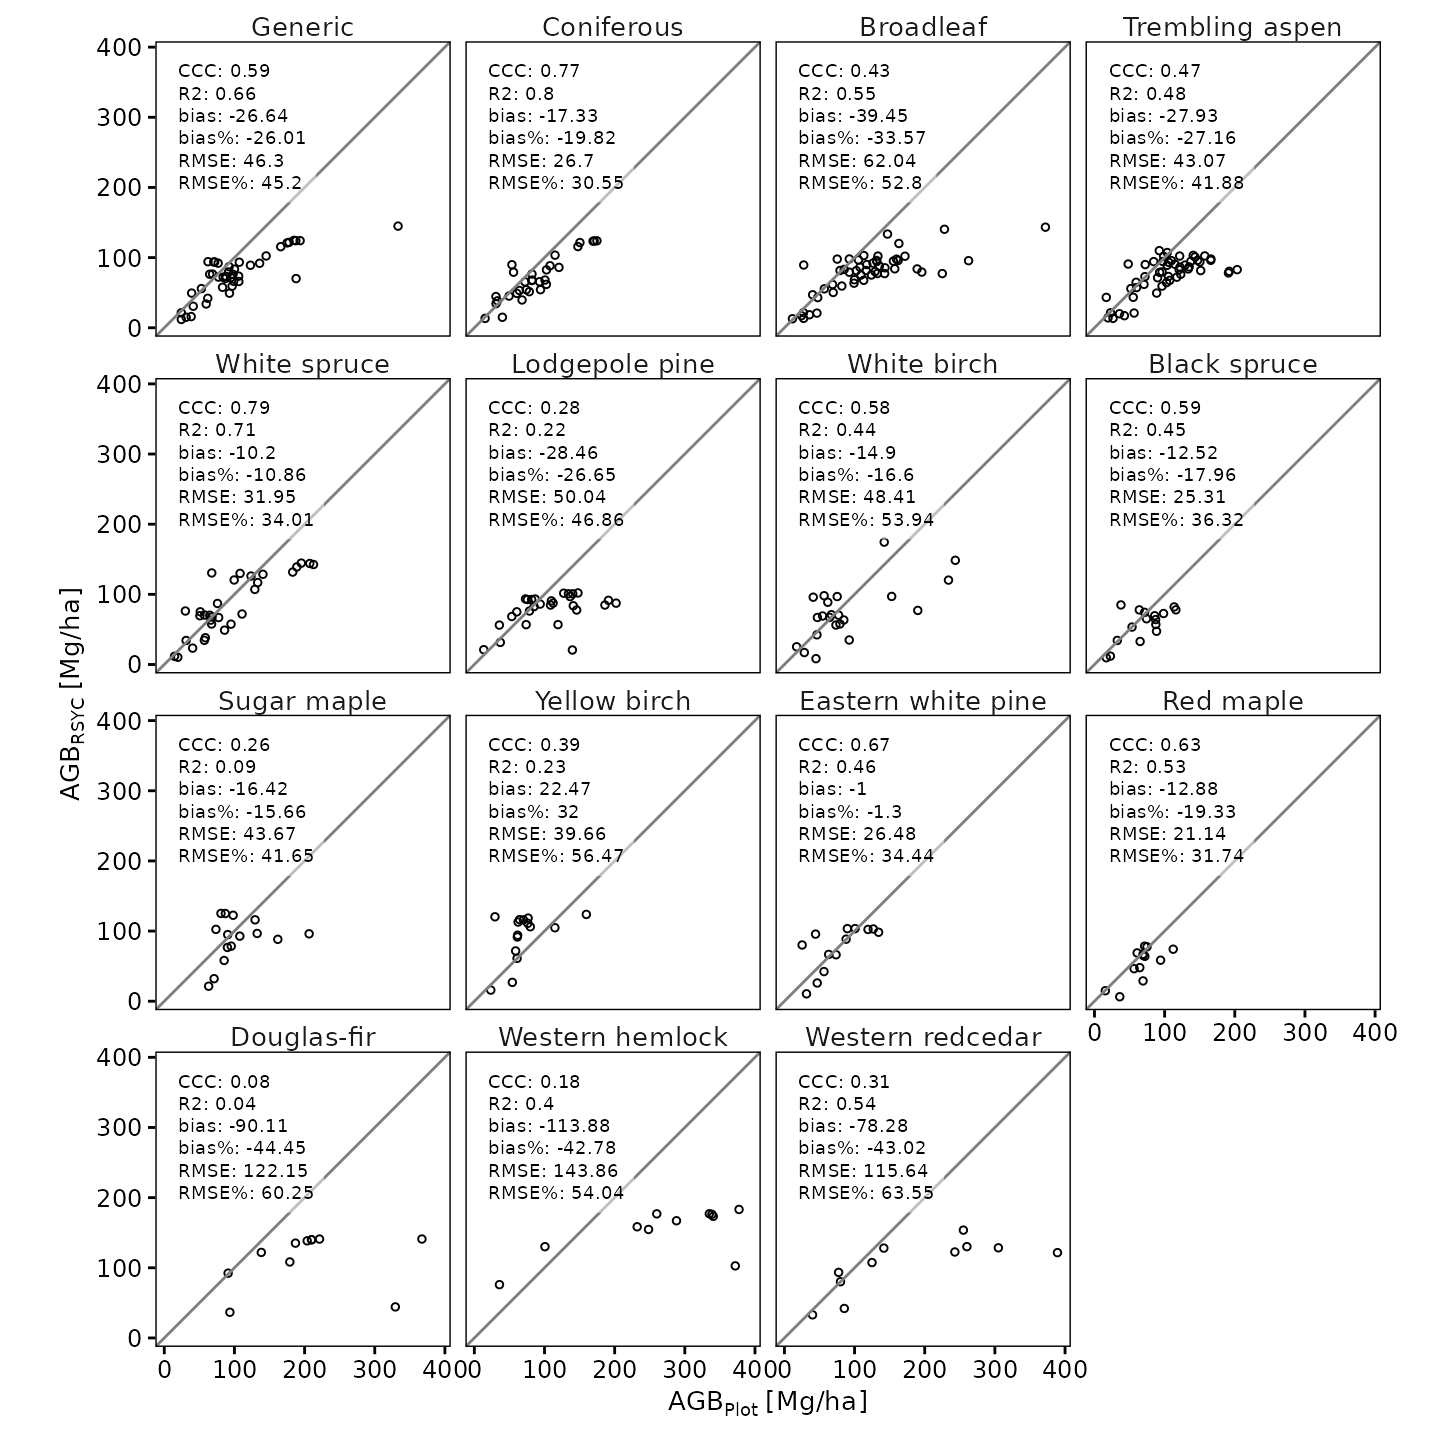
780 age-class points from 109 curves. Map these curves in the curve explorer.
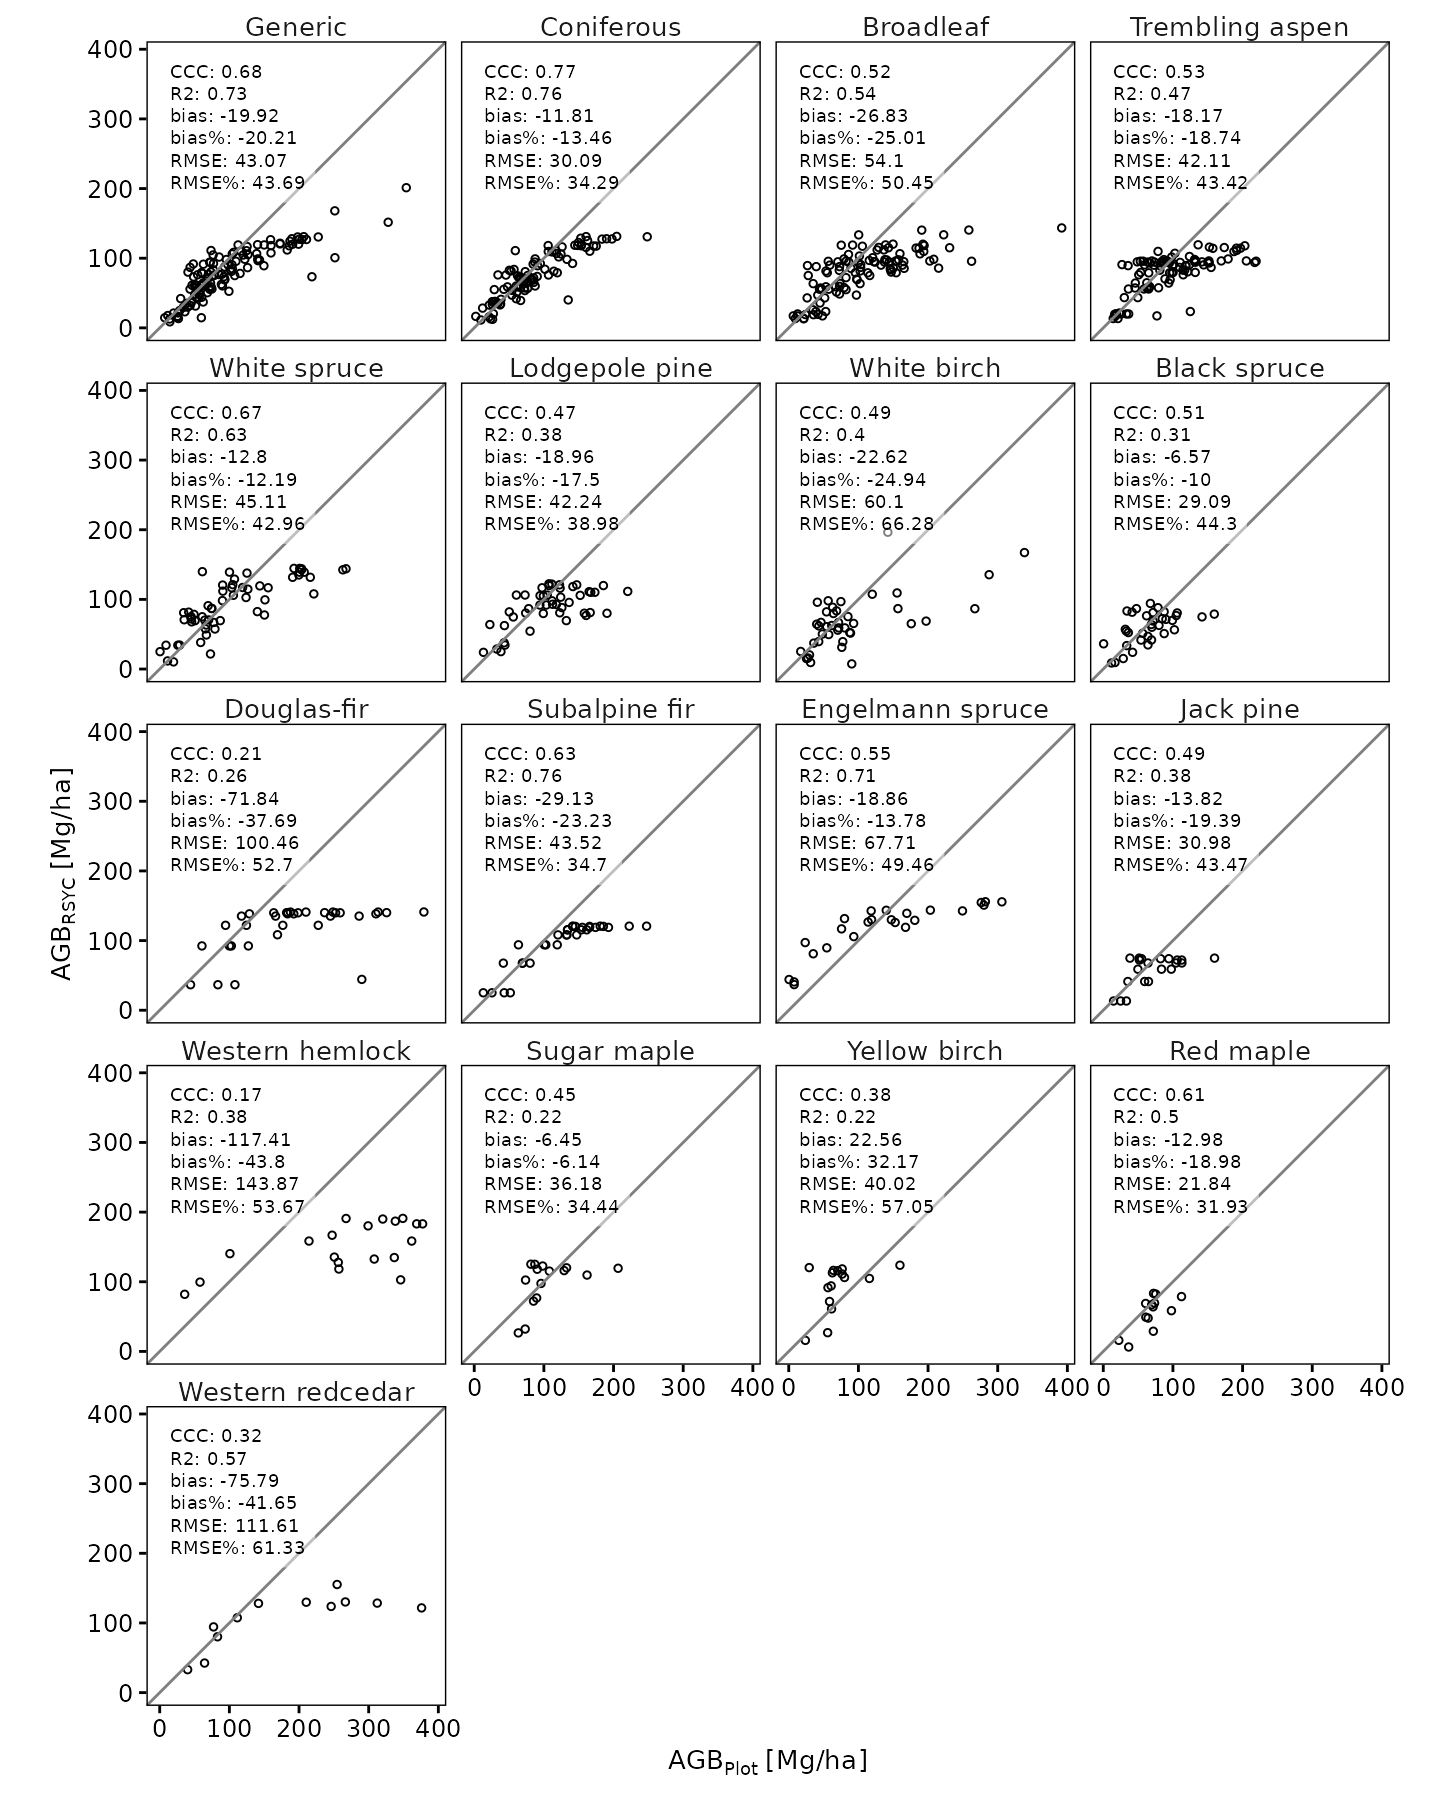
1,715 age-class points from 255 curves. Map these curves in the curve explorer.
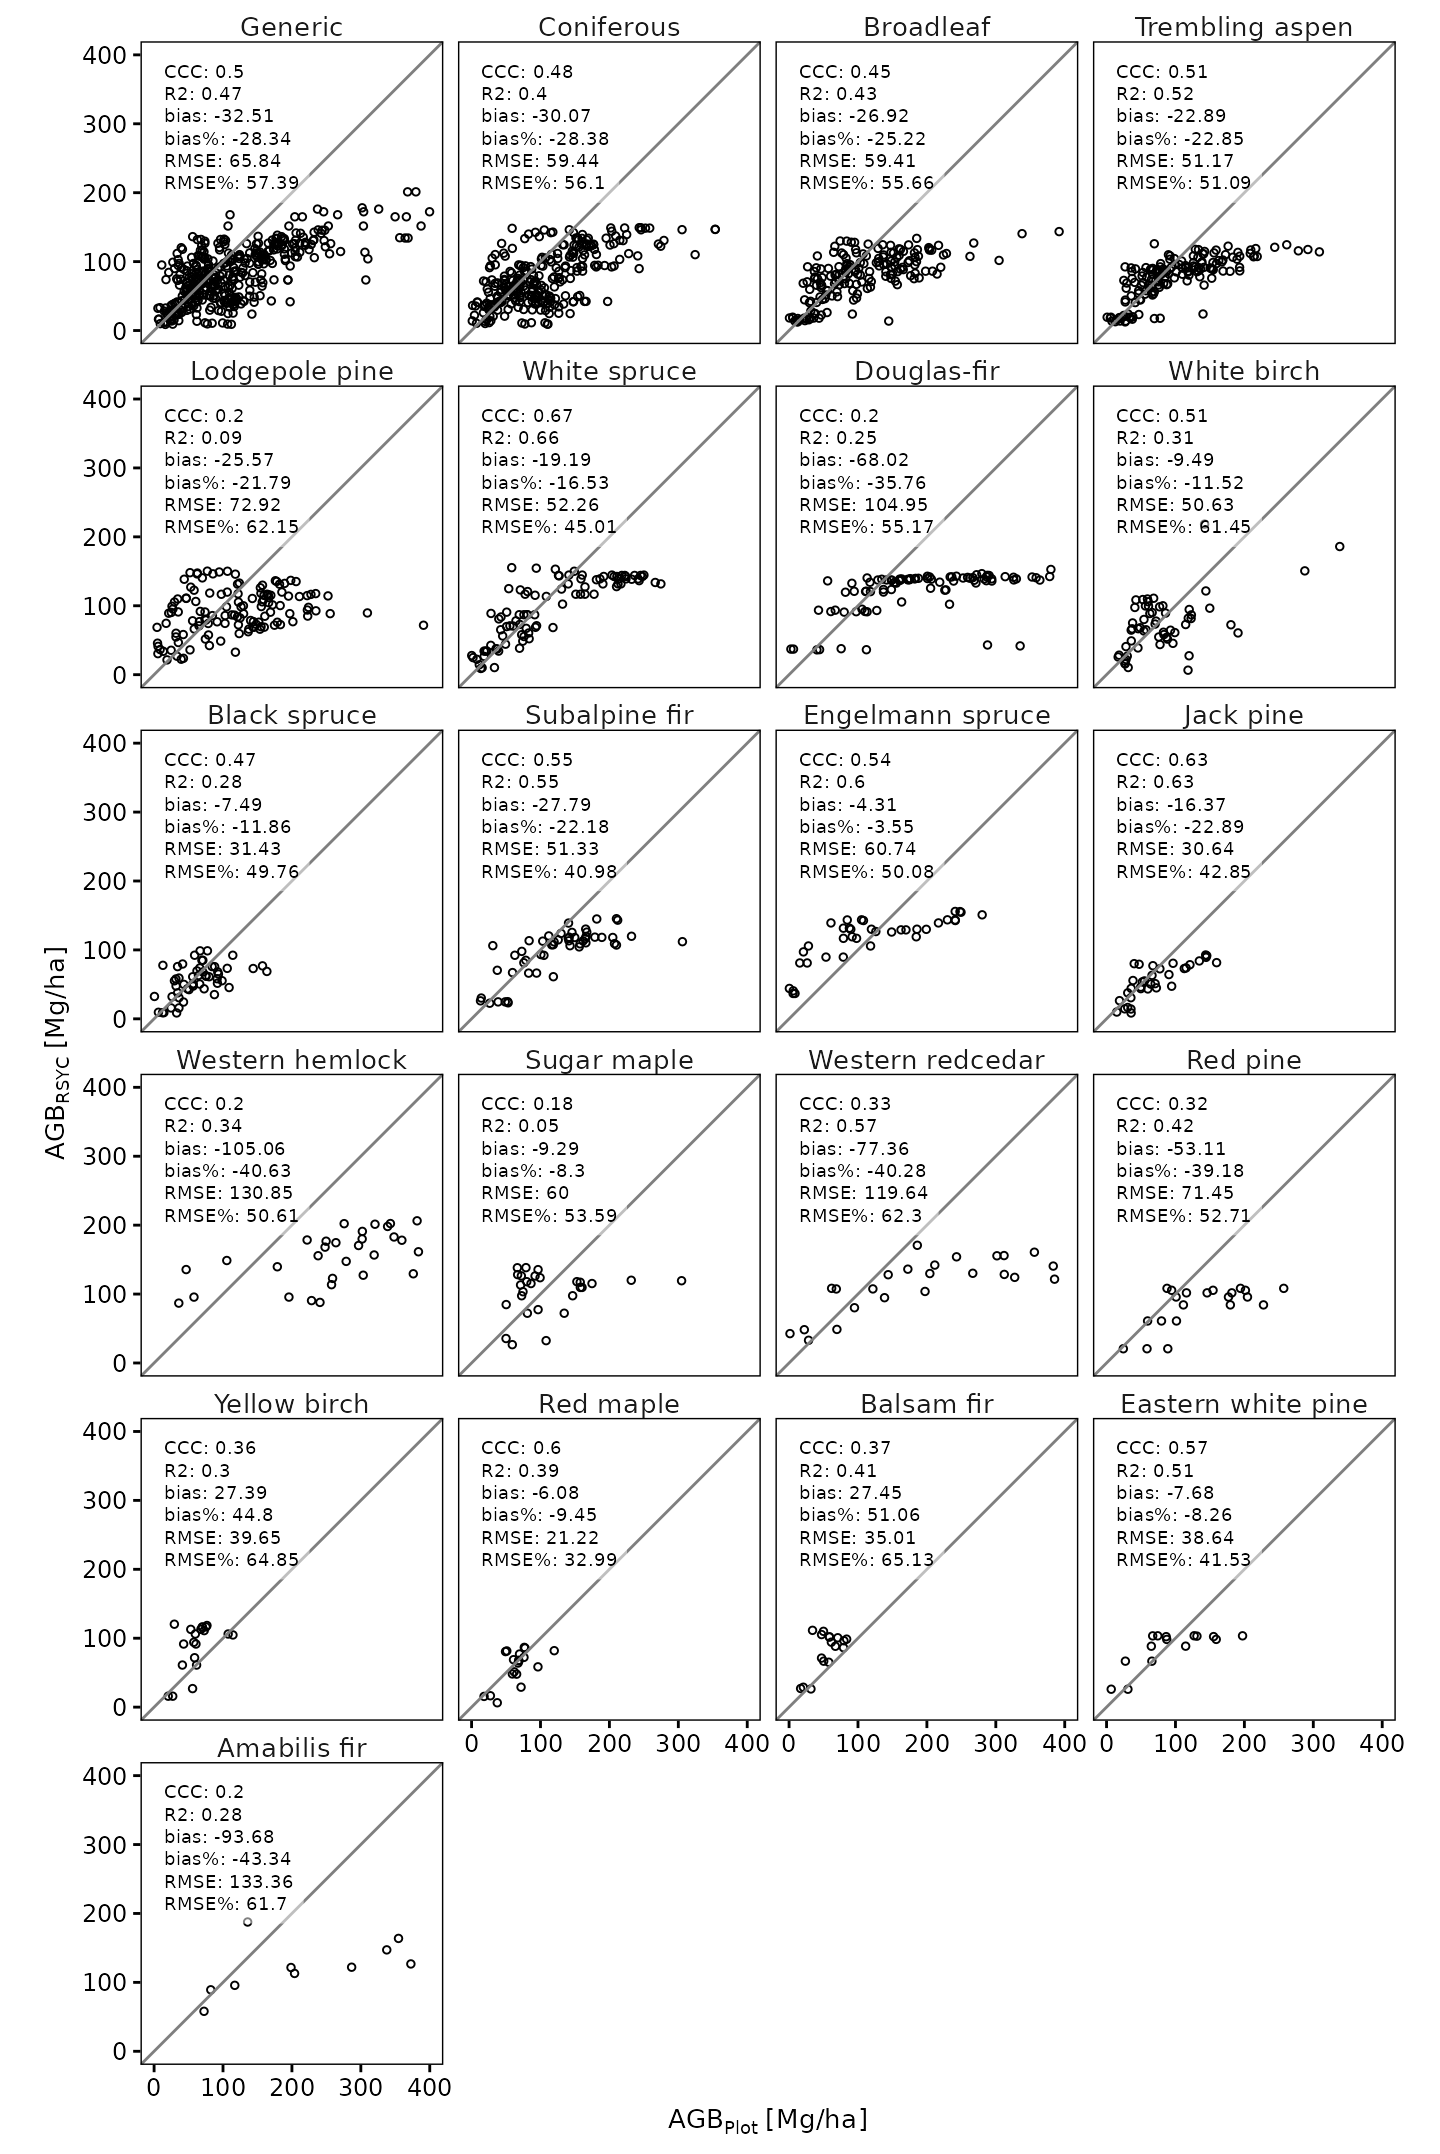
3,401 age-class points from 537 curves. Map these curves in the curve explorer.
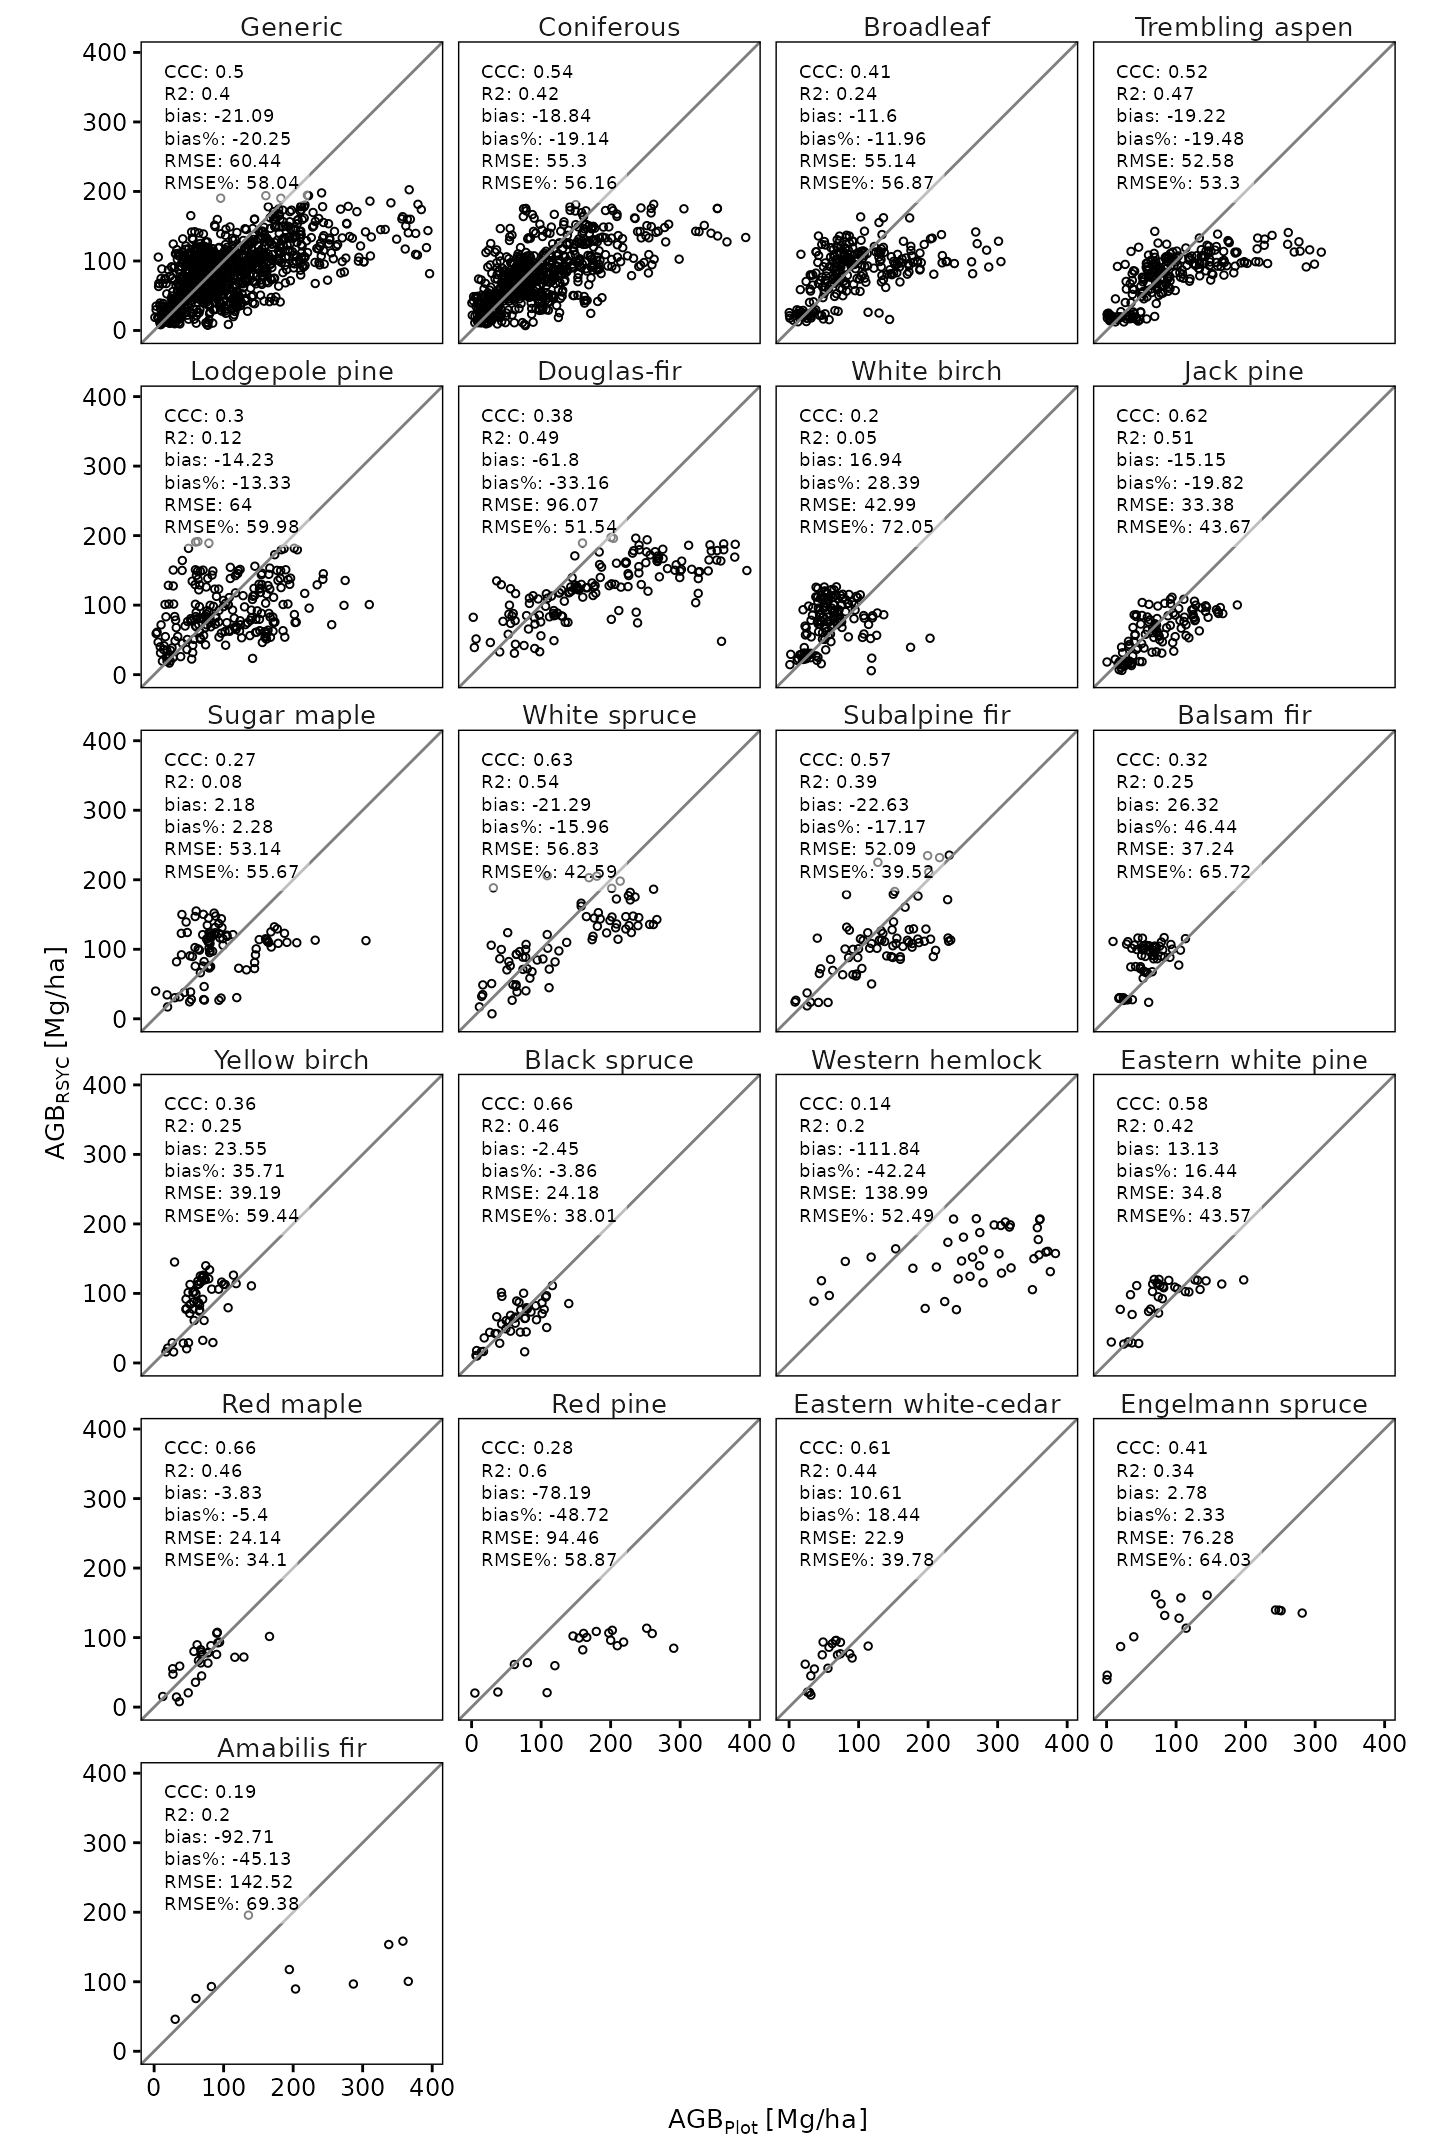
Volume
National models
4,255 age-class points from 641 curves. Map these curves in the curve explorer.
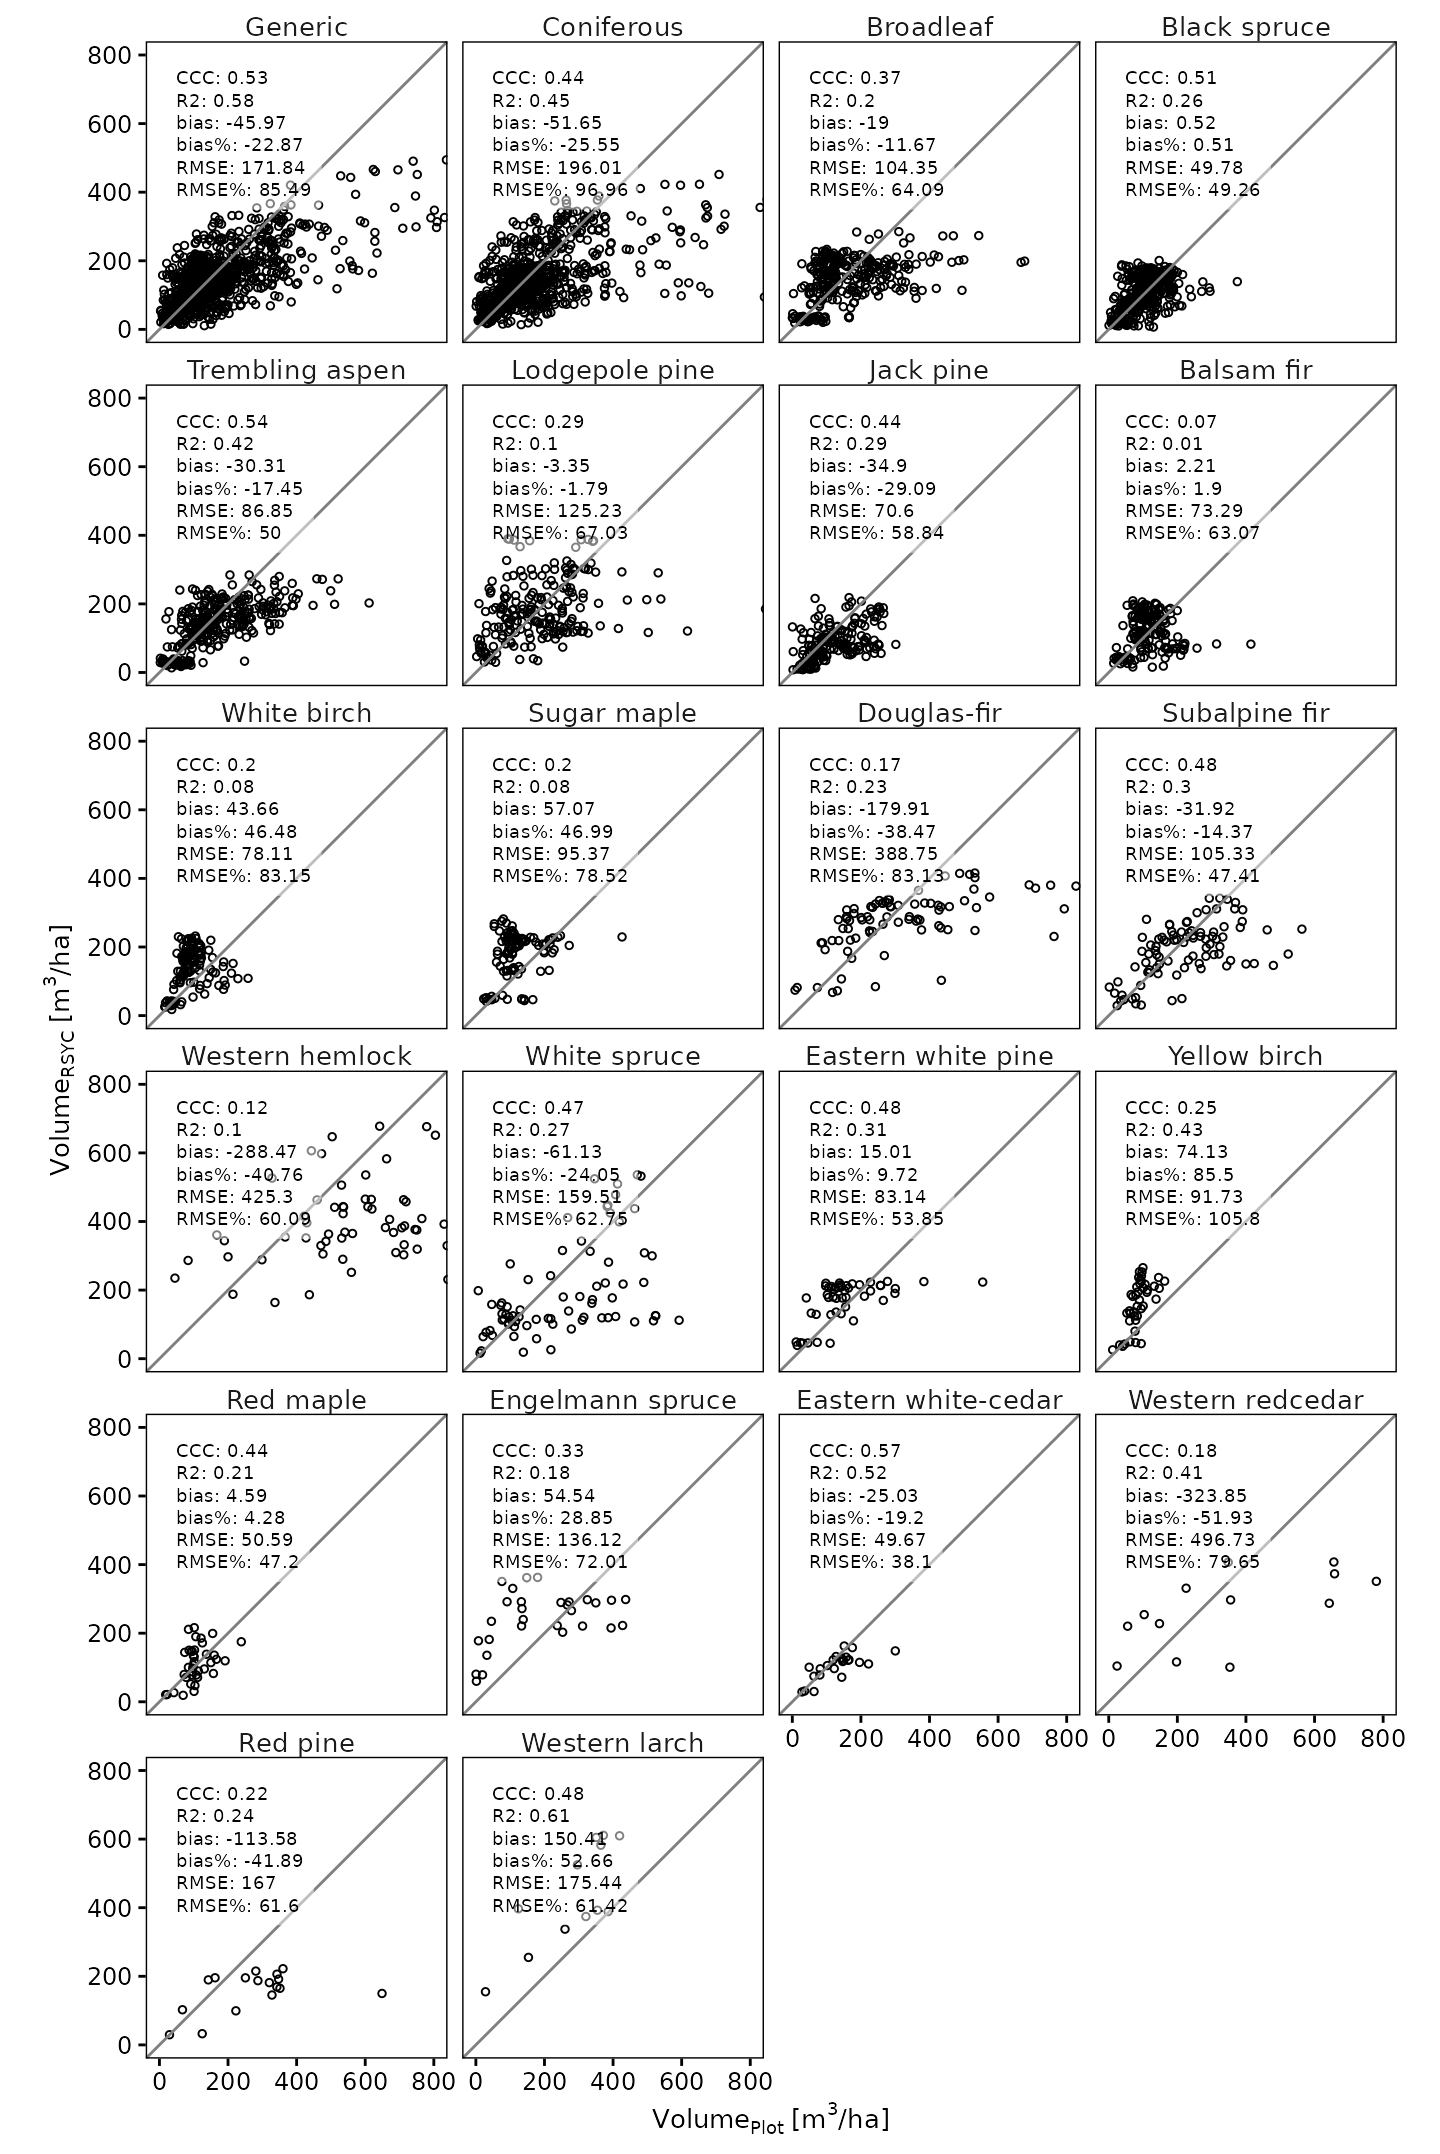
553 age-class points from 75 curves. Map these curves in the curve explorer.
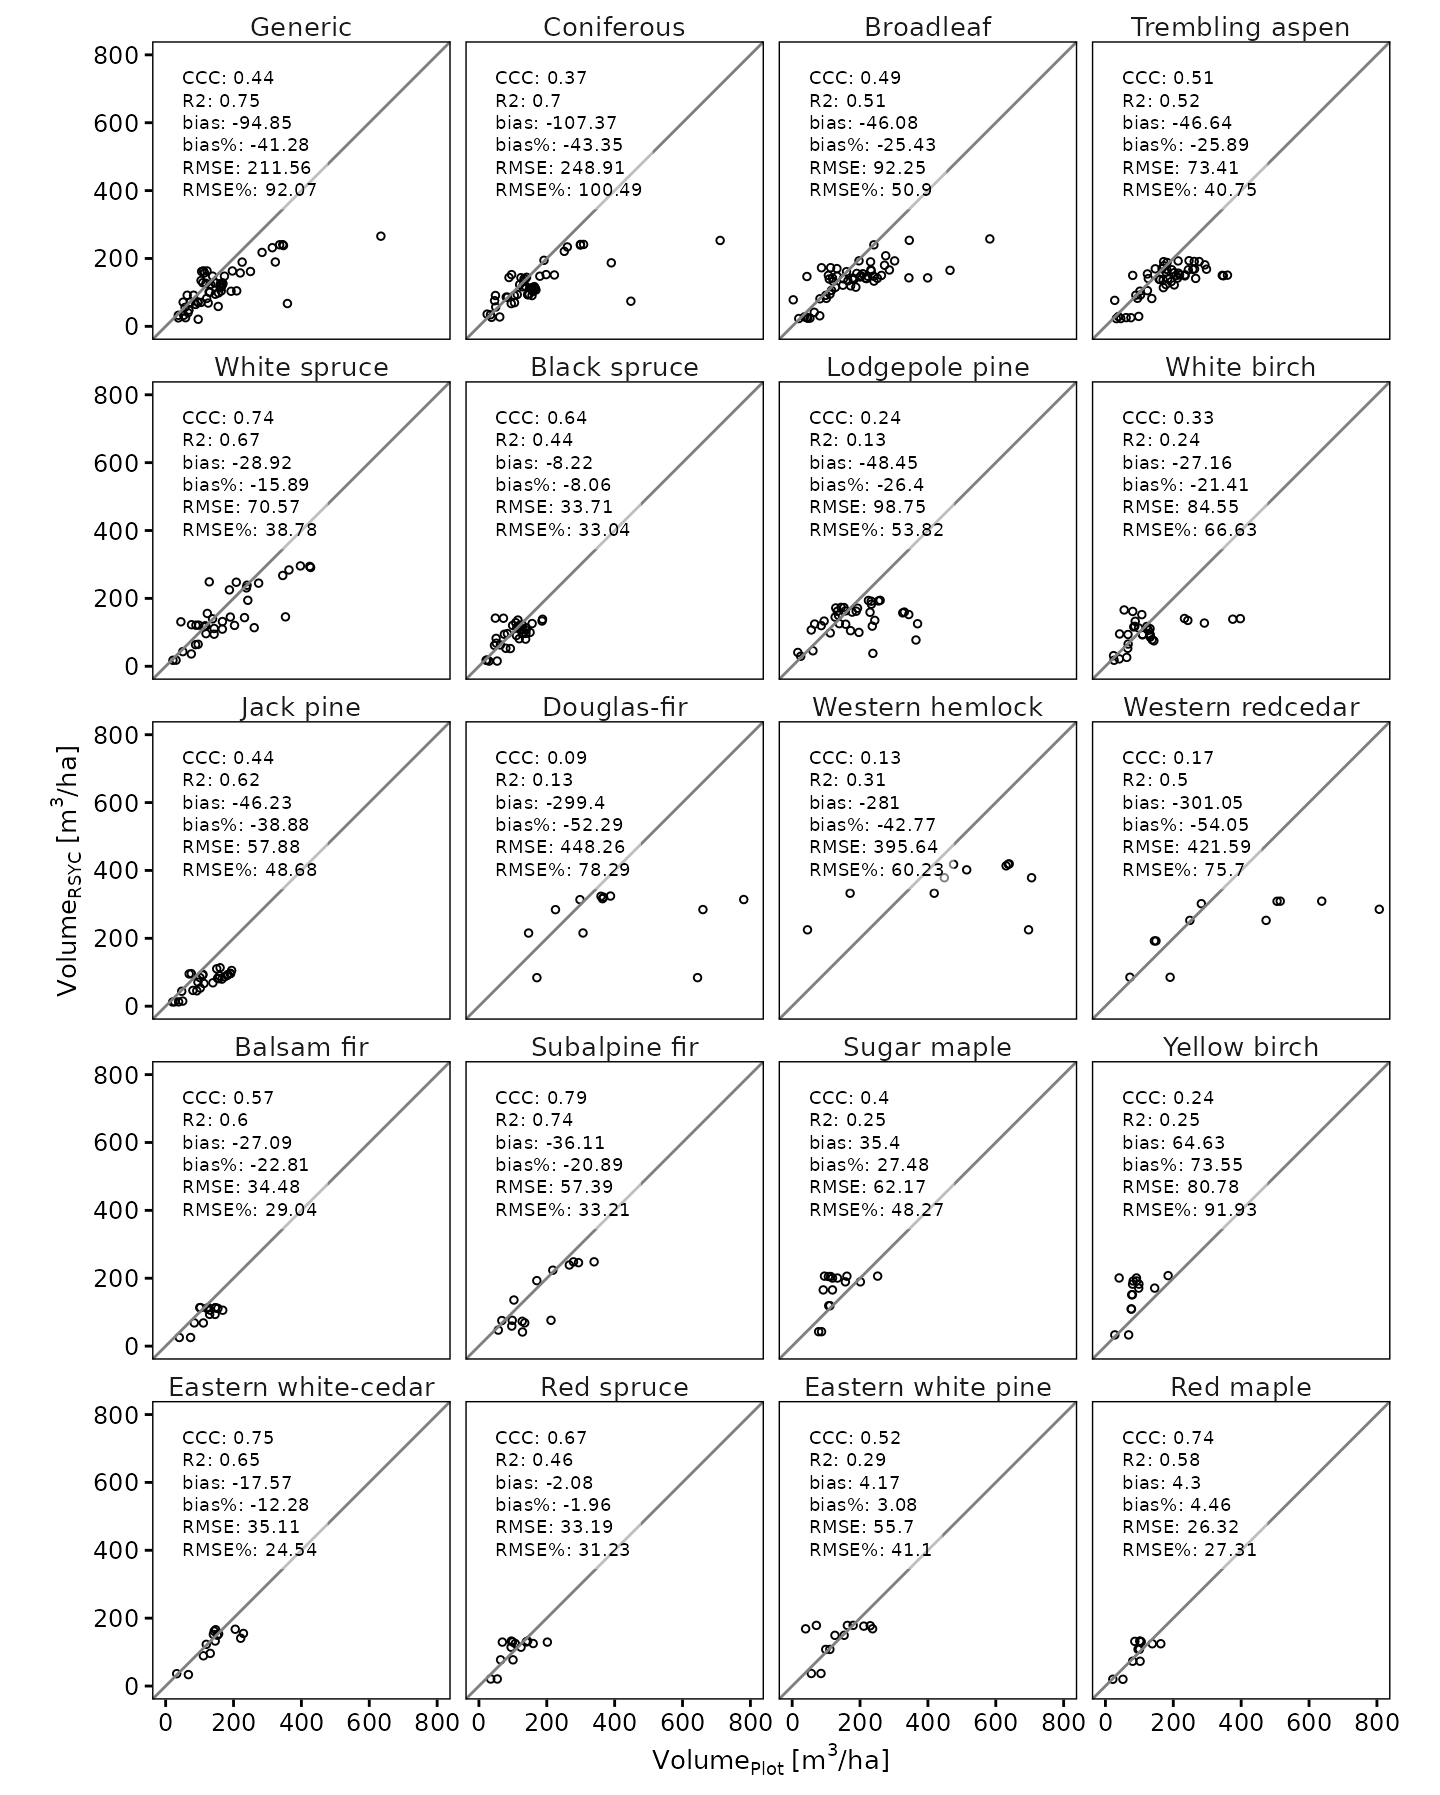
1,054 age-class points from 144 curves. Map these curves in the curve explorer.
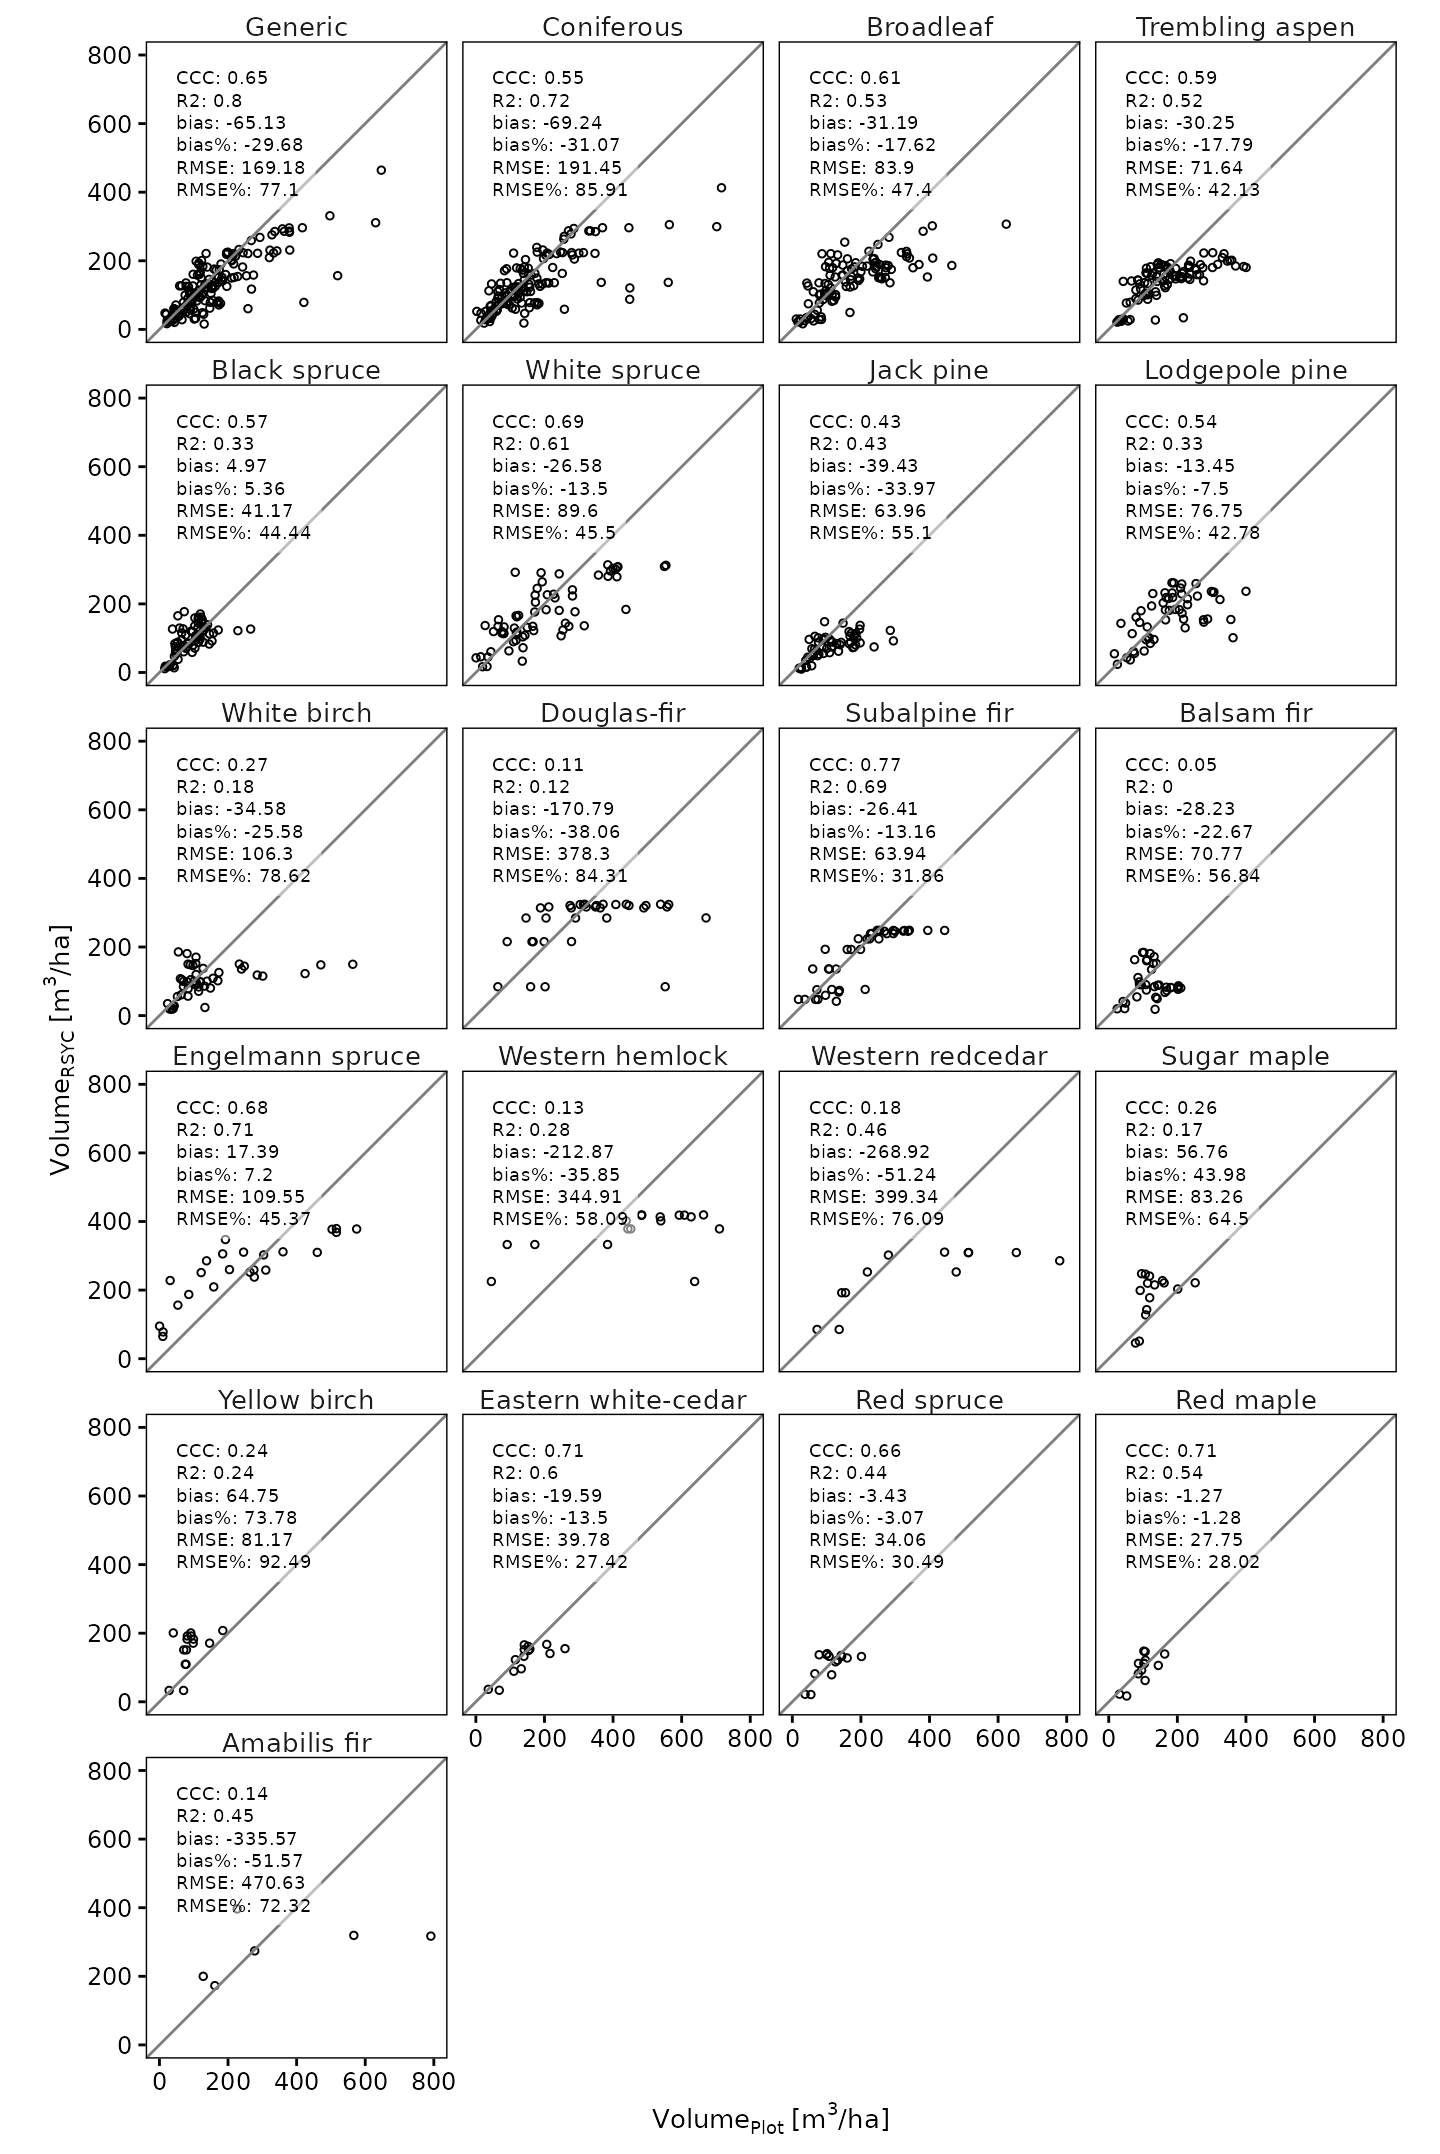
2,224 age-class points from 320 curves. Map these curves in the curve explorer.
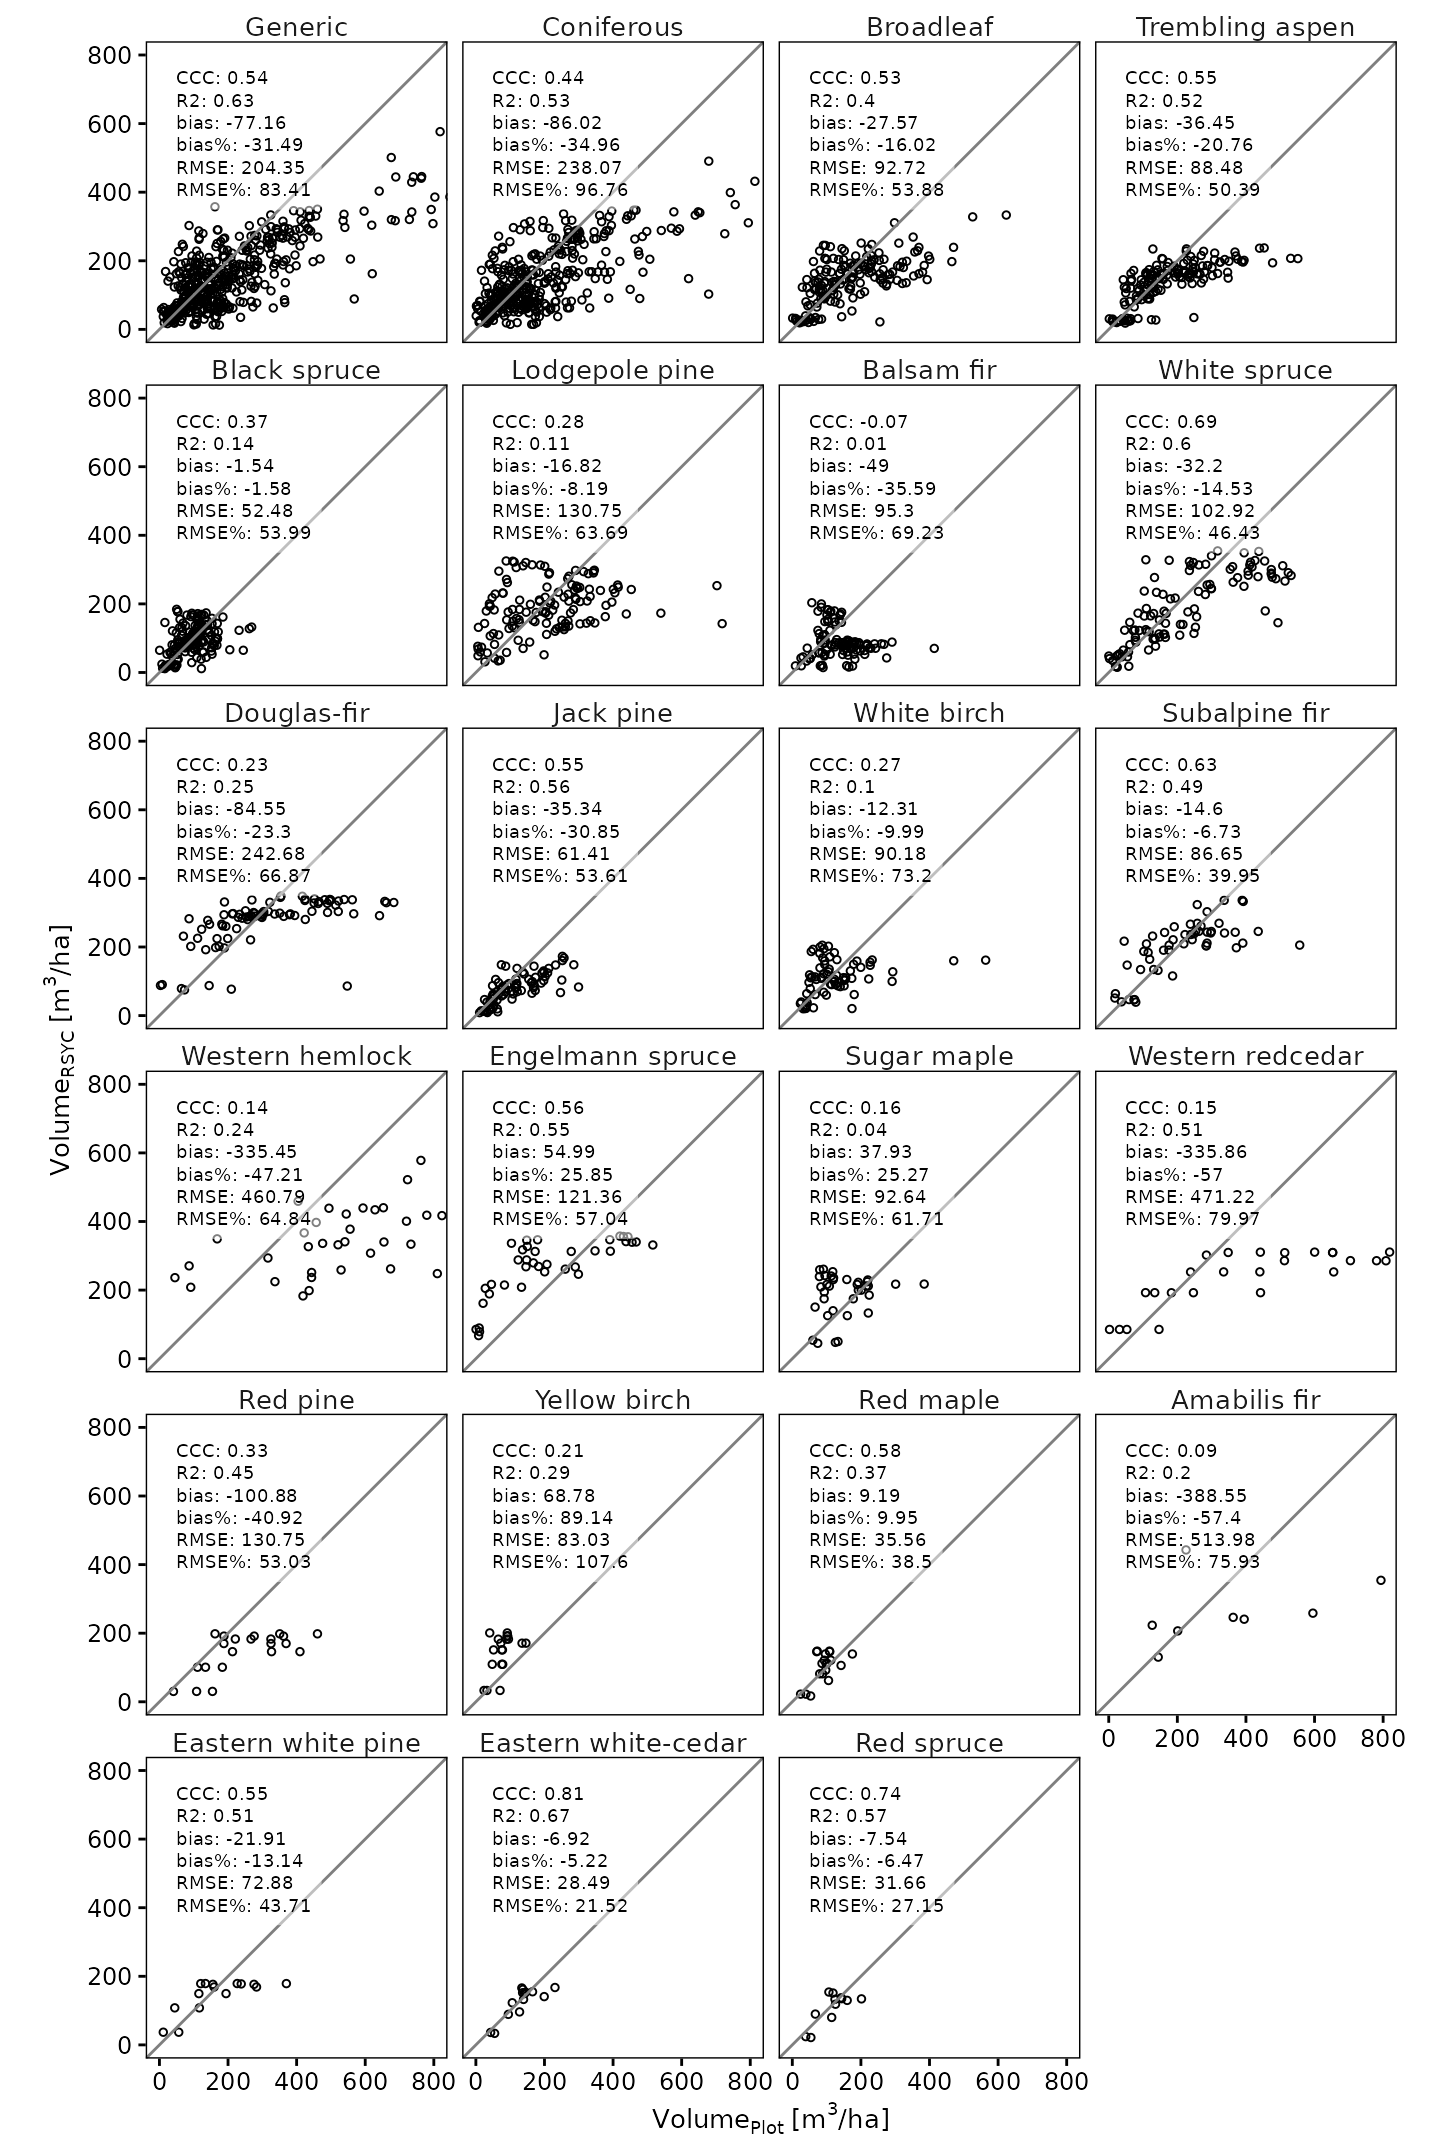
4,410 age-class points from 683 curves. Map these curves in the curve explorer.
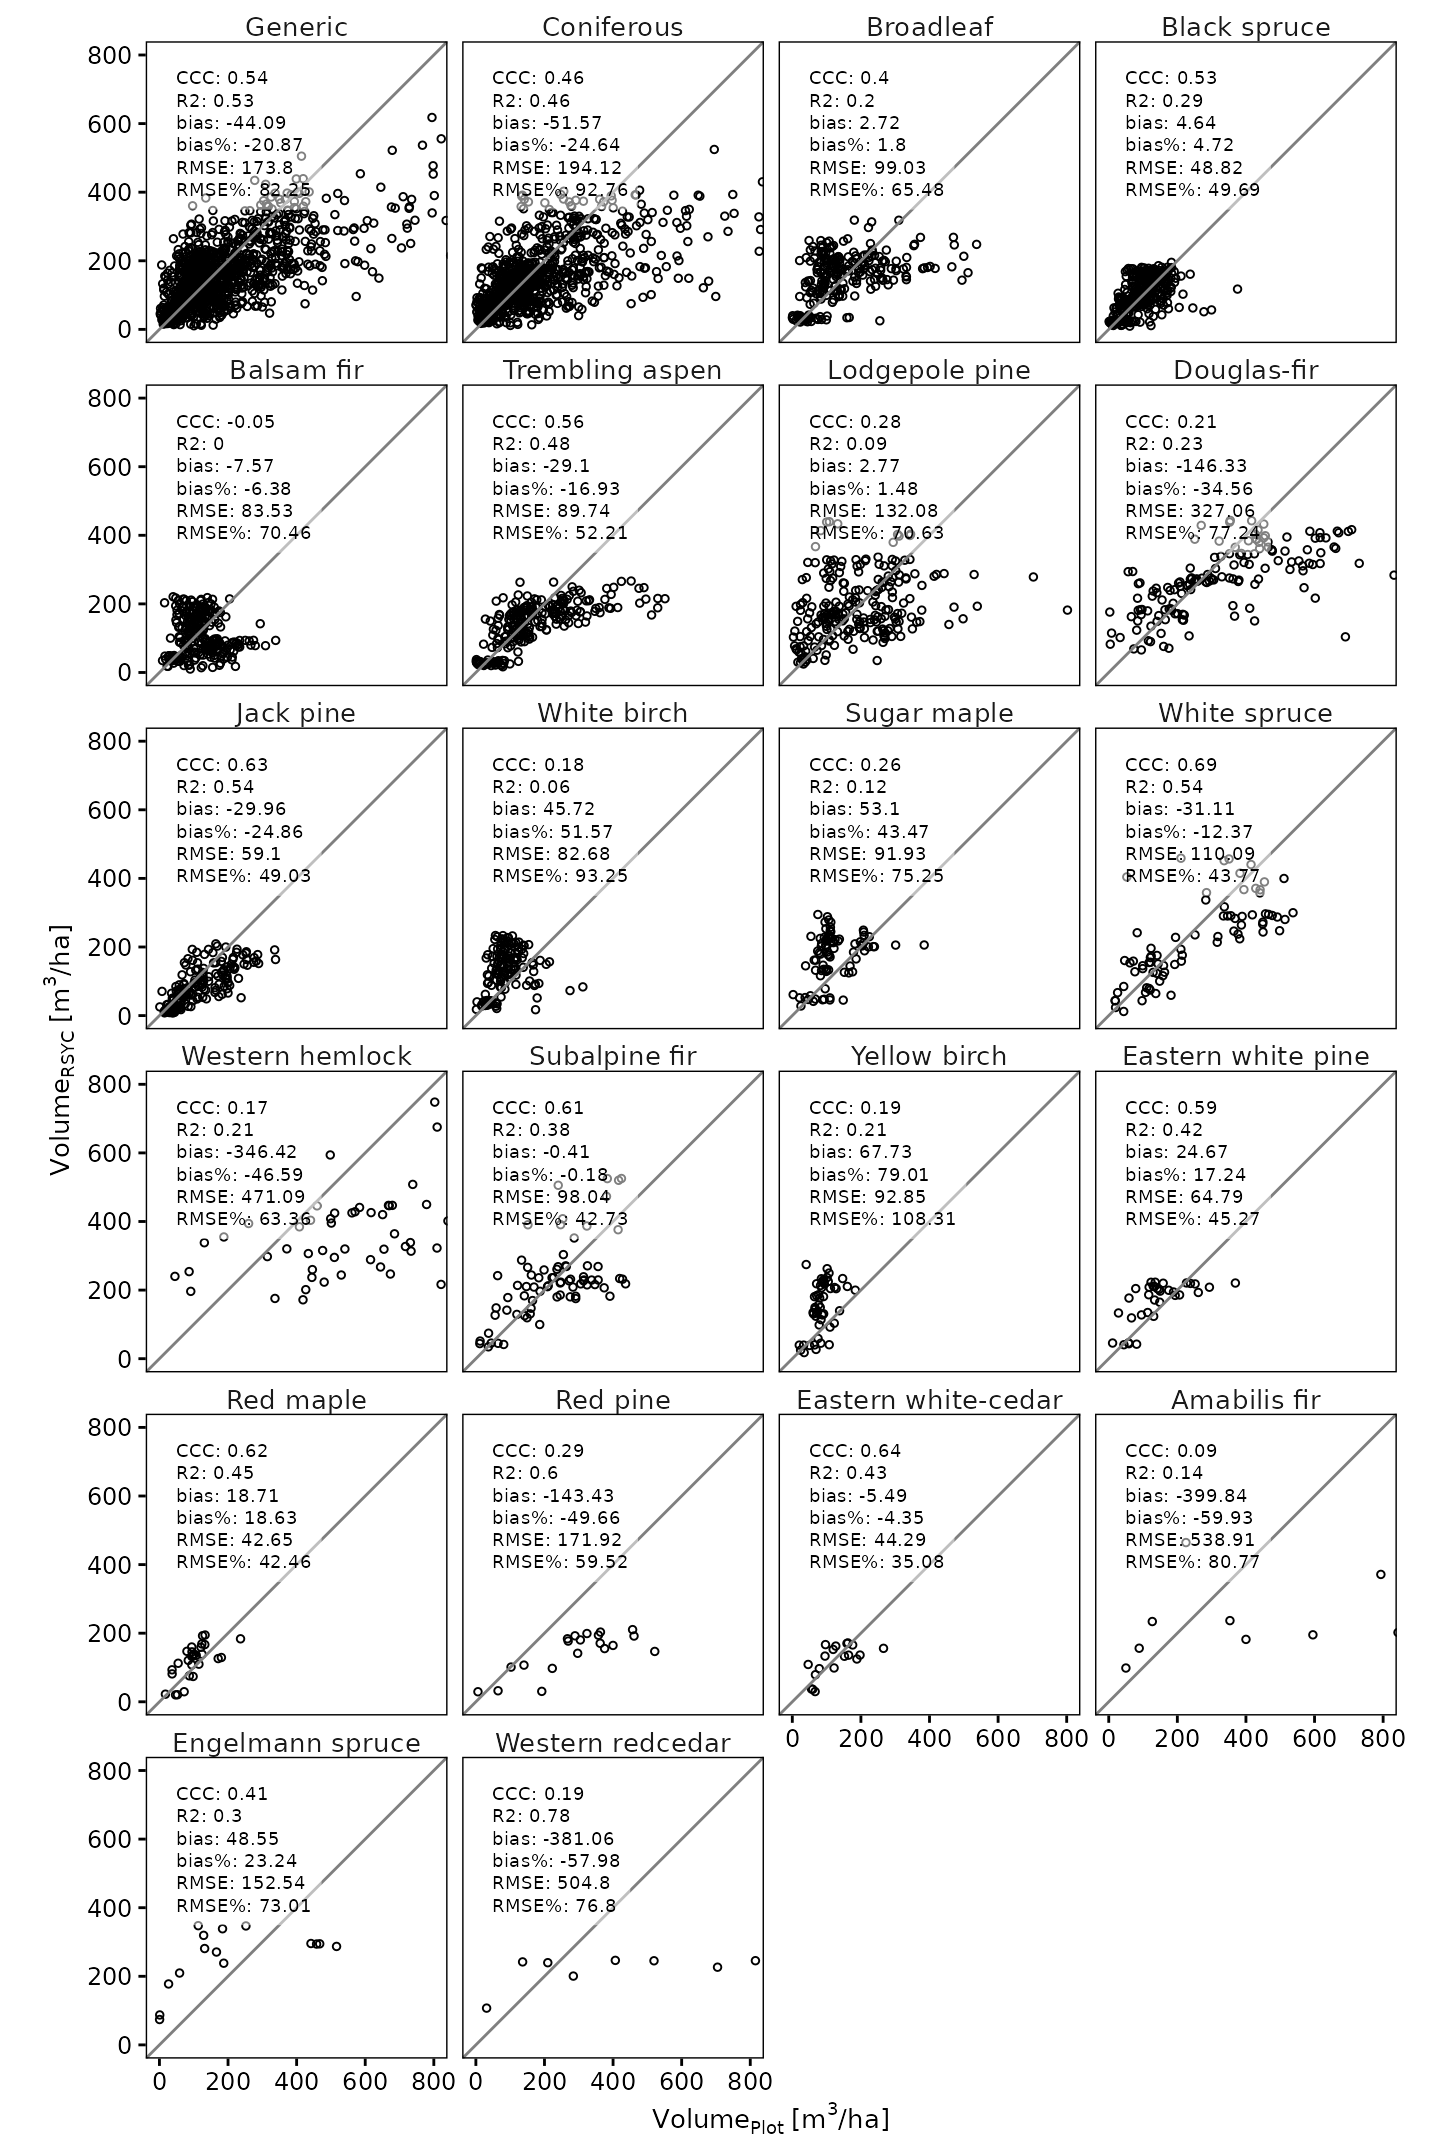
Regional models
2,218 age-class points from 337 curves. Map these curves in the curve explorer.
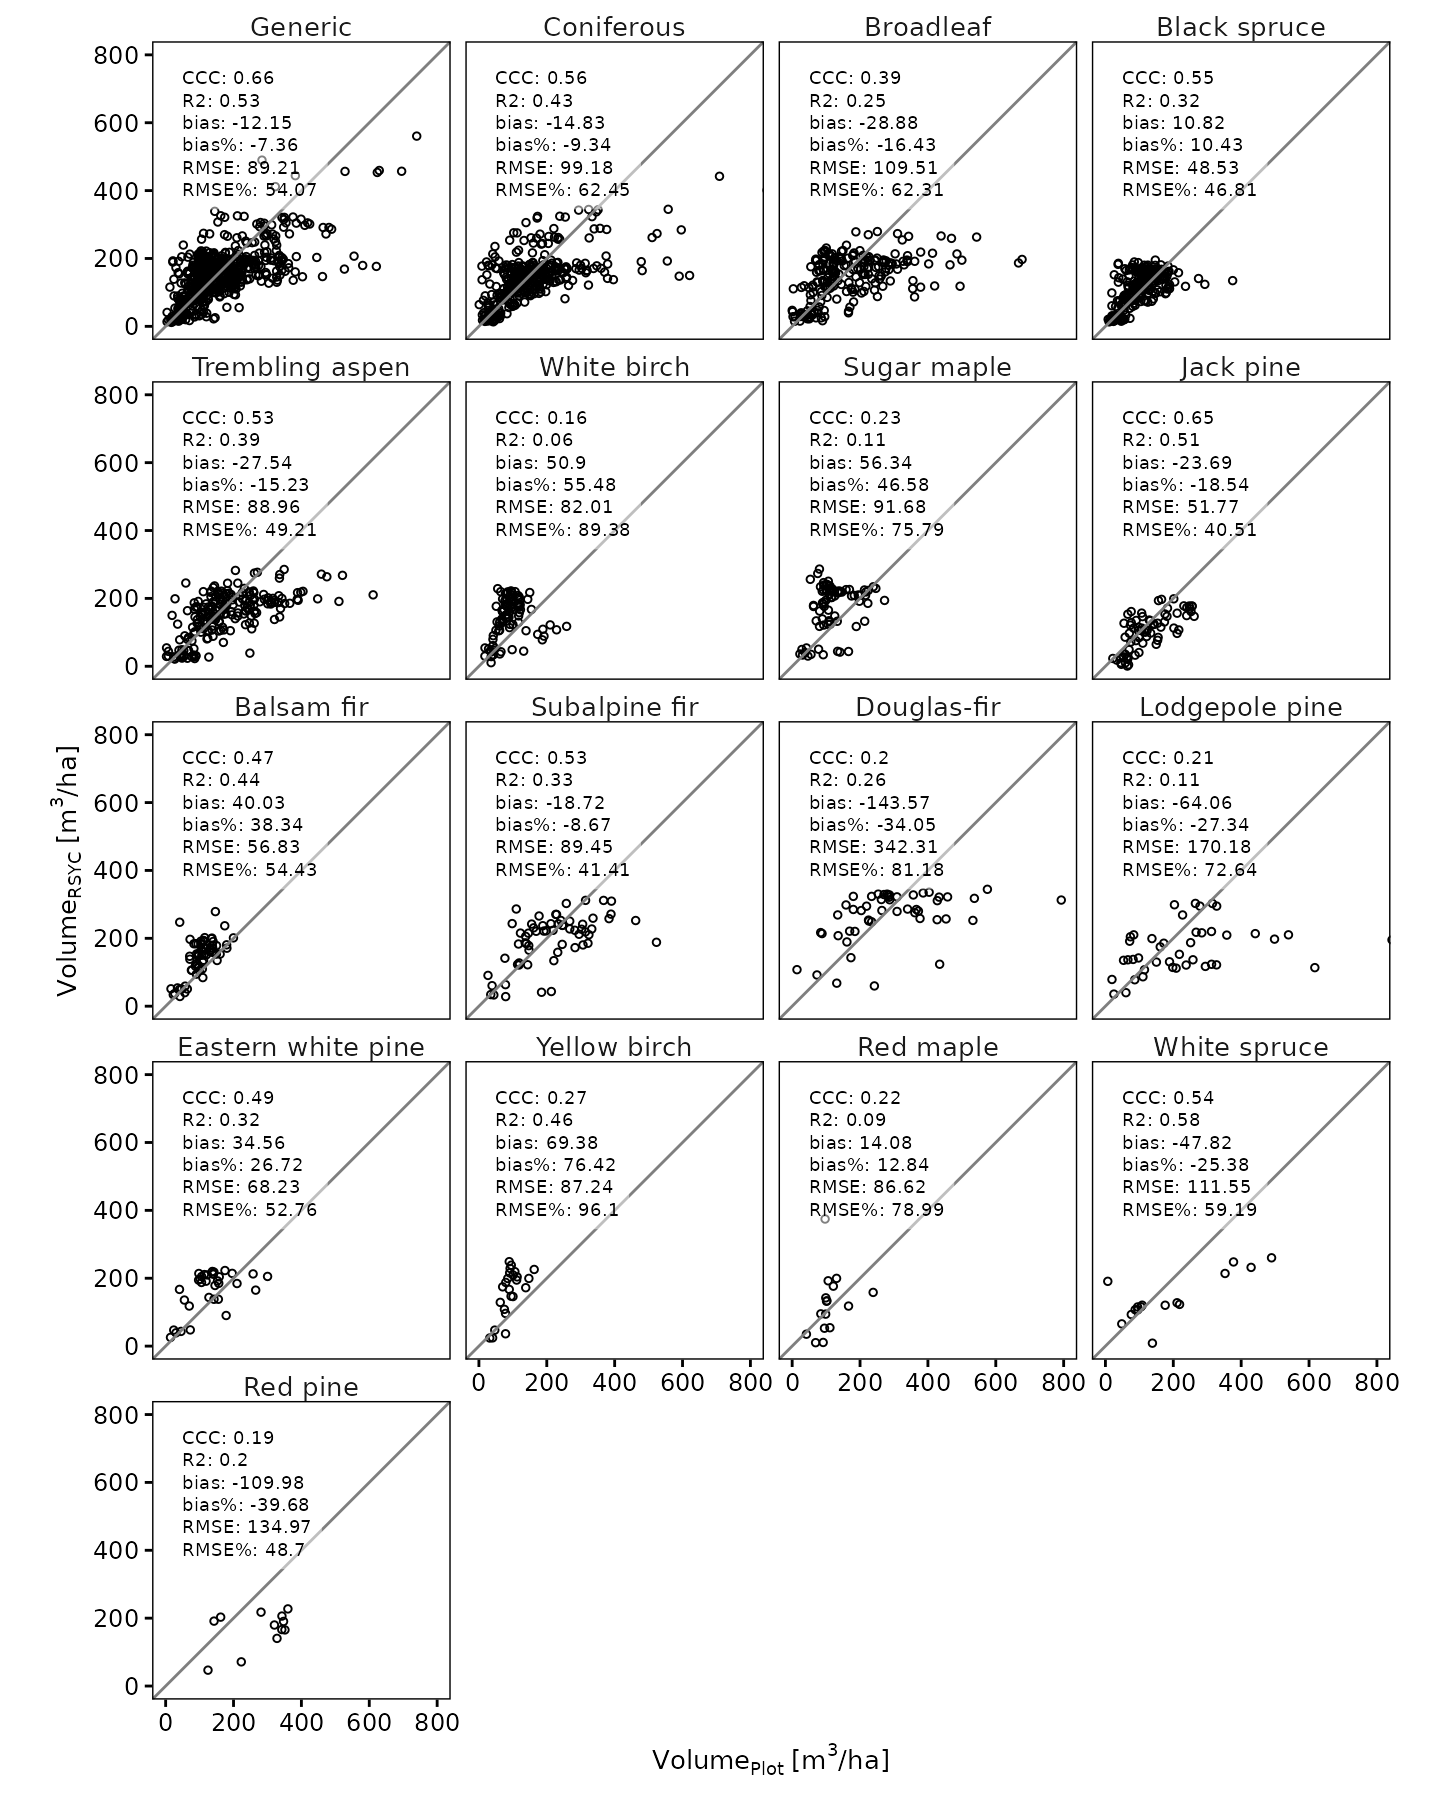
423 age-class points from 57 curves. Map these curves in the curve explorer.
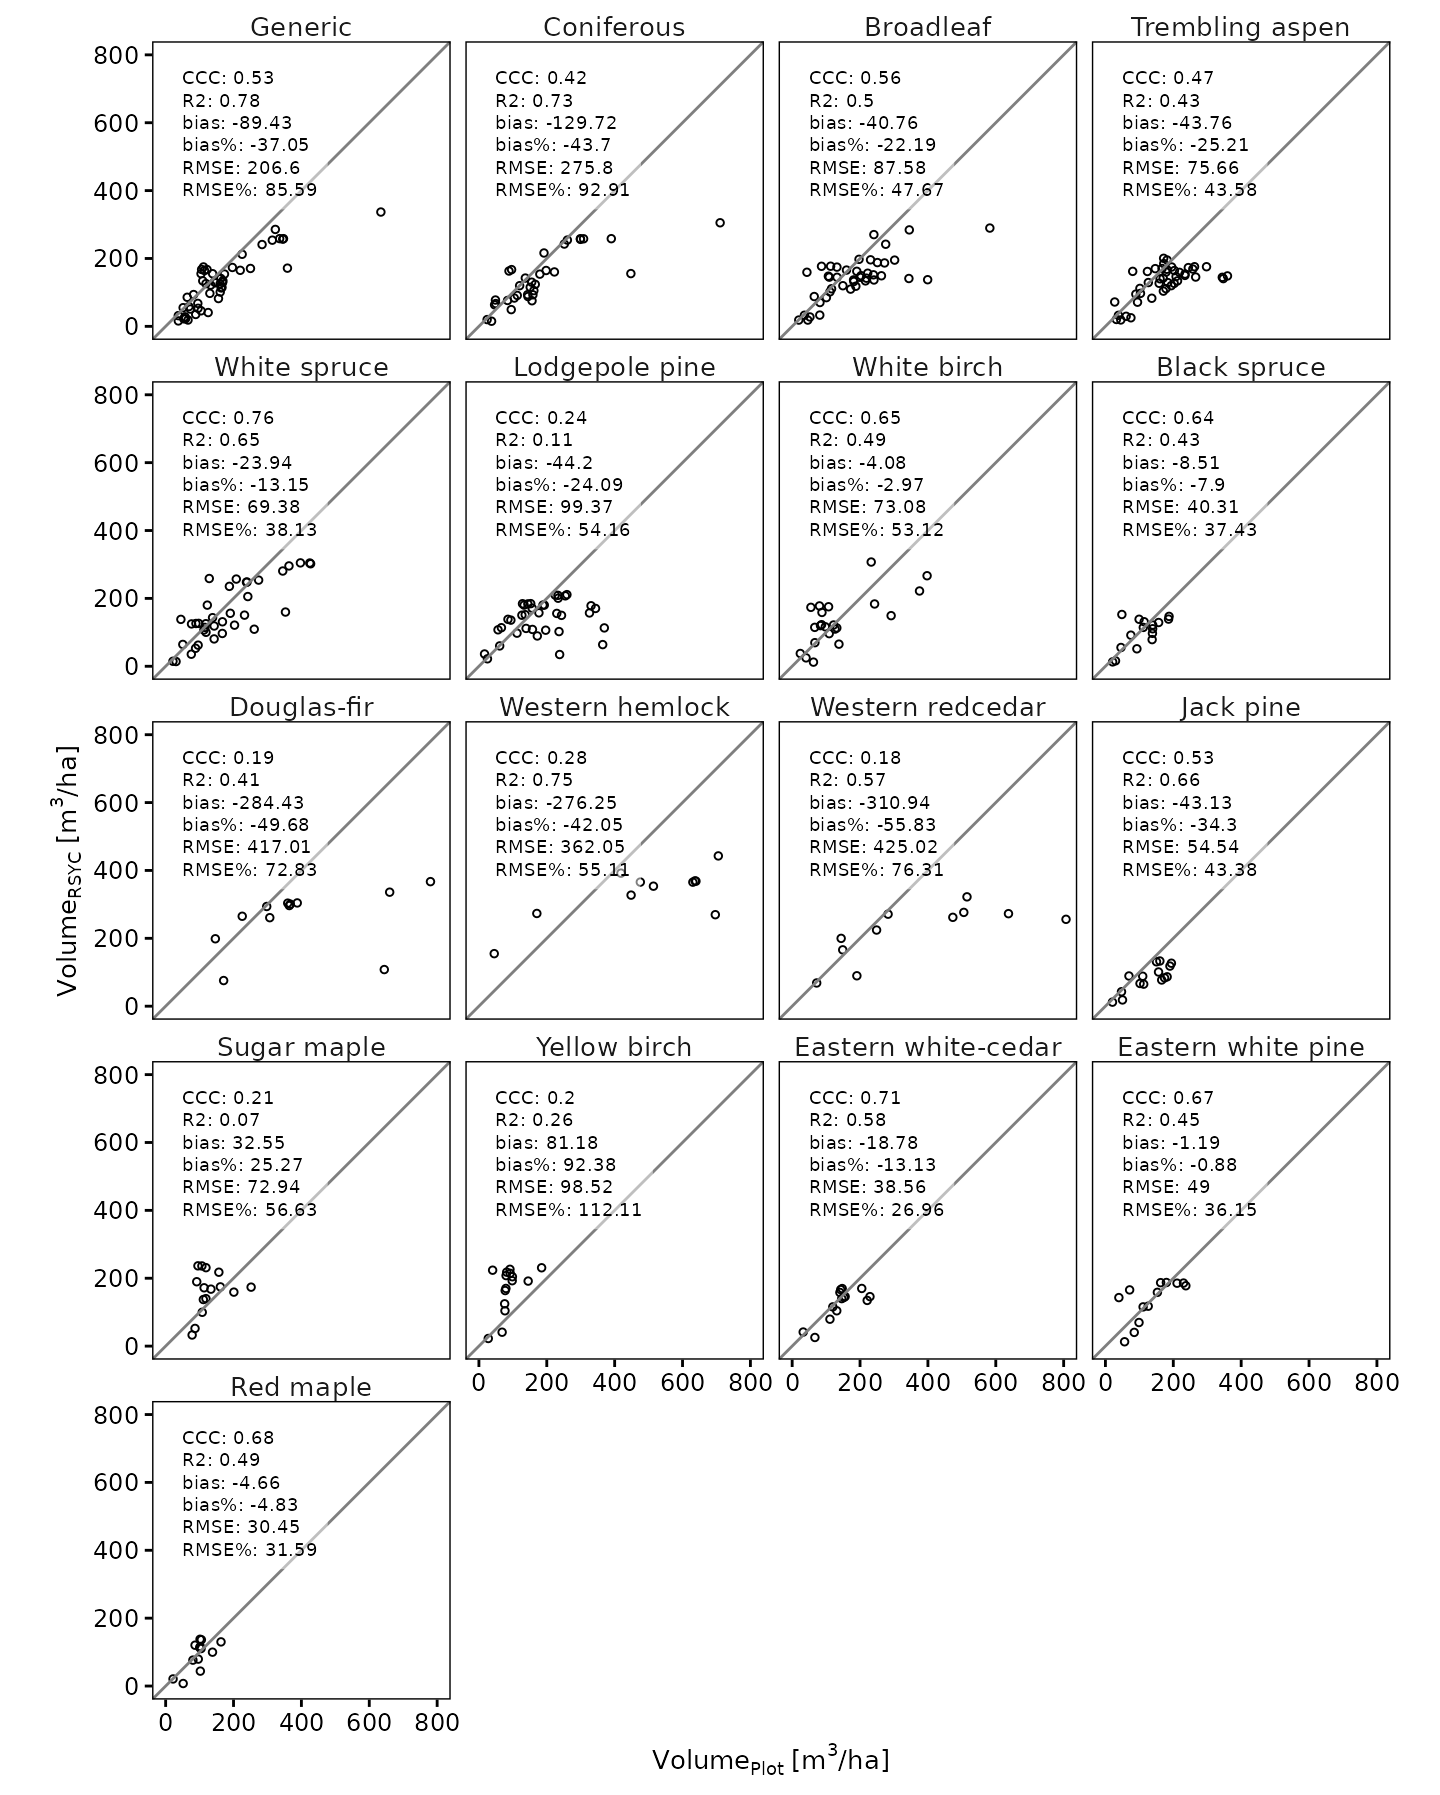
852 age-class points from 115 curves. Map these curves in the curve explorer.
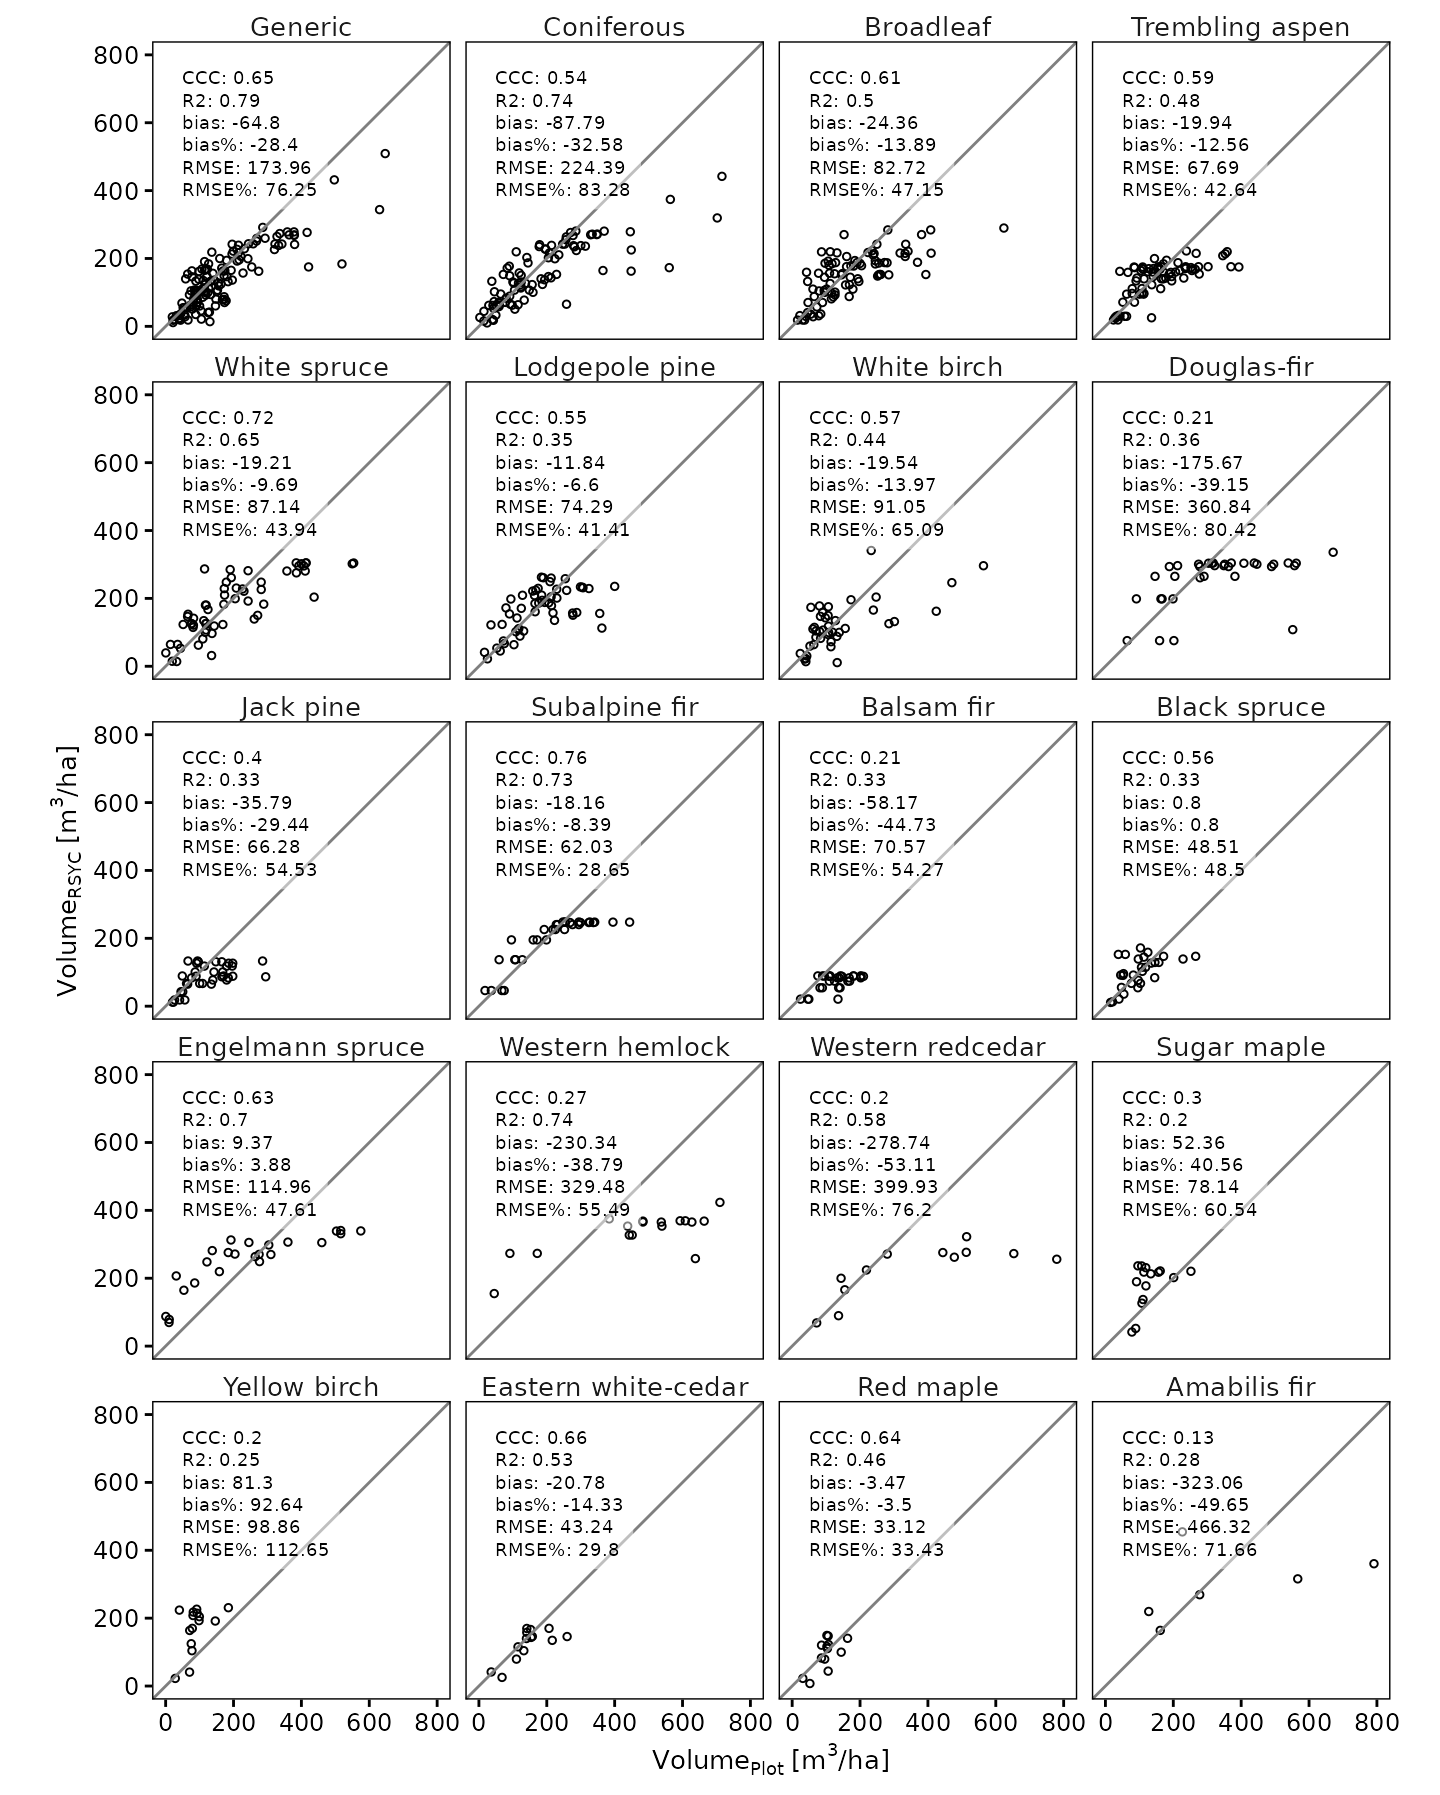
1,817 age-class points from 258 curves. Map these curves in the curve explorer.
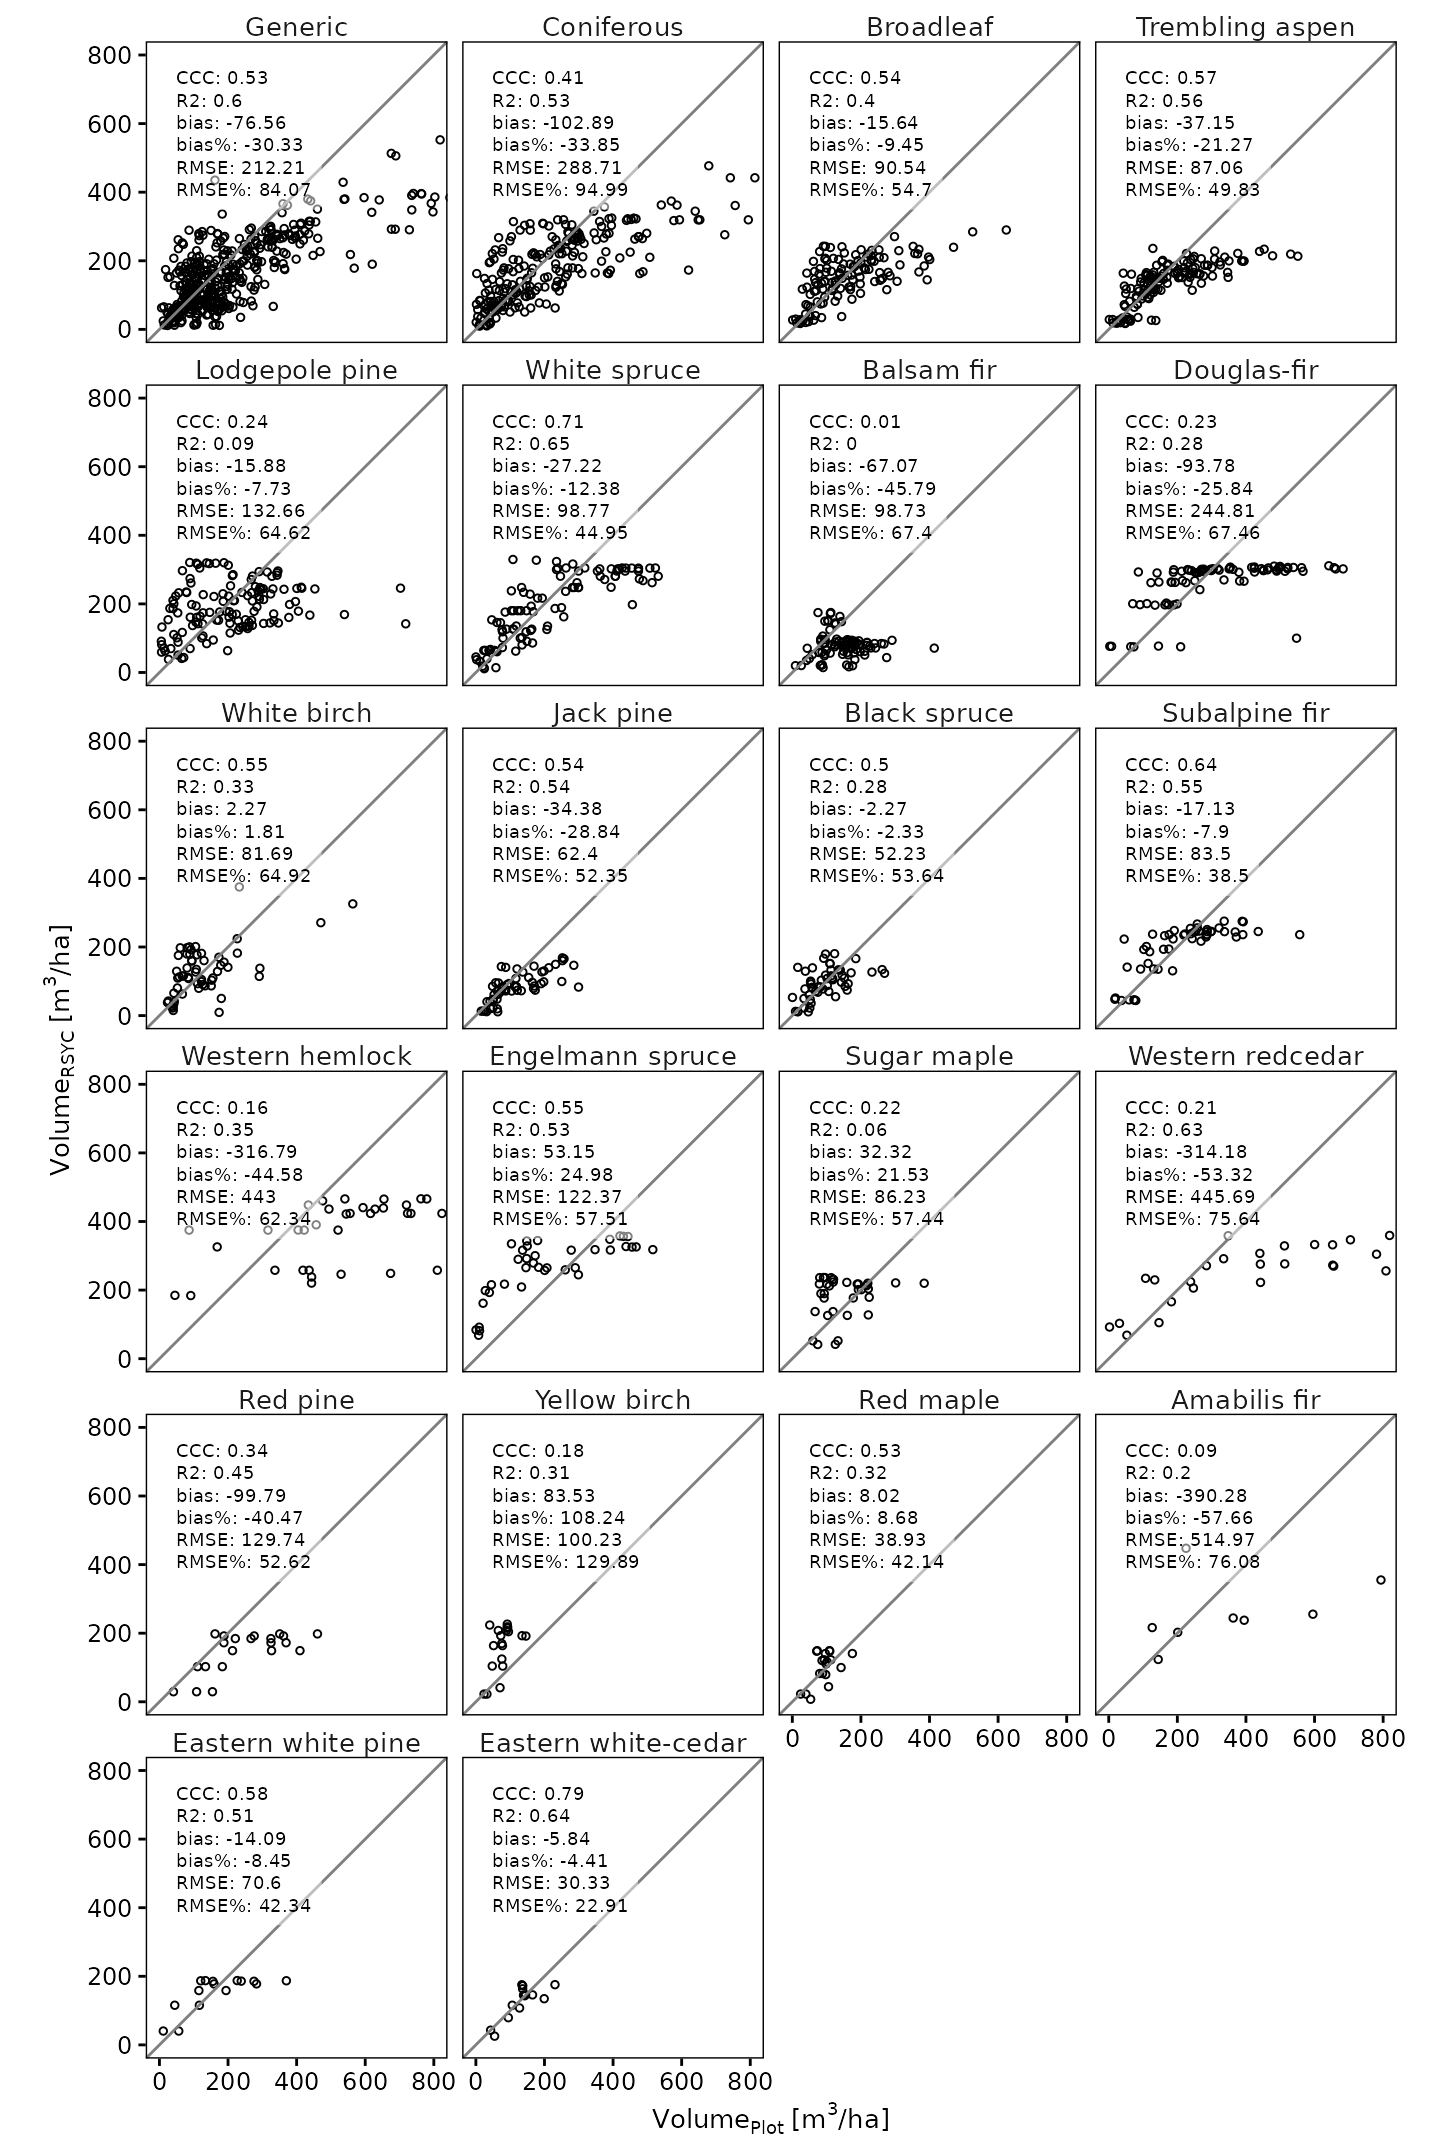
3,477 age-class points from 537 curves. Map these curves in the curve explorer.